- Don’t miss your chance to experience Discovery Summit Europe at our best available rate! Early bird registration through 31 Oct.
- Graph Builder Toolbar streamlines interactive graphing. Creates shortcuts on Report and GraphBuilder Helpers toolbars. Download and install the extension.
- Subscribe to RSS Feed
- Mark Topic as New
- Mark Topic as Read
- Float this Topic for Current User
- Bookmark
- Subscribe
- Mute
- Printer Friendly Page
Discussions
Solve problems, and share tips and tricks with other JMP users.- User Community
- :
- Discussions
- :
- Re: Questions about Pareto Plot of Estimates

- Mark as New
- Bookmark
- Subscribe
- Mute
- Subscribe to RSS Feed
- Get Direct Link
- Report Inappropriate Content
Questions about Pareto Plot of Estimates
Dear community,
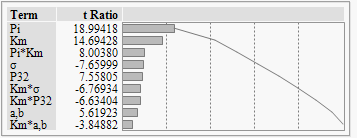
I have three short questions about Pareto Plot of Estimates.
1. How is t Ratio calculated?
2. How can I interpret t Ratio?
3. The solid black line is cumulative of t Ratio; however, how can I interpret this line?
Thank you!

- Mark as New
- Bookmark
- Subscribe
- Mute
- Subscribe to RSS Feed
- Get Direct Link
- Report Inappropriate Content
Re: Questions about Pareto Plot of Estimates
1. t ratio is the parameter estimate/ standard error of the parameter estimate.
2. t ratio is but one 'statistic' that can be used to evaluate the significance level of a given parameter estimate.
3. The curve is just the sum of the absolute values of the t ratio, it's main purpose is to give you an idea of the relative explanatory power of each estimate wrt to the others.
- Mark as New
- Bookmark
- Subscribe
- Mute
- Subscribe to RSS Feed
- Get Direct Link
- Report Inappropriate Content
Re: Questions about Pareto Plot of Estimates
Thank you for your reply.
Is it possible to change from t-ratio to estimated effect instead?
Sincerely,
TK
- Mark as New
- Bookmark
- Subscribe
- Mute
- Subscribe to RSS Feed
- Get Direct Link
- Report Inappropriate Content
Re: Questions about Pareto Plot of Estimates
I would generally advise against trying to intentionally change names for statistics, tests, and general nomenclature in JMP to other 'words'. In general JMP developers go to great lengths to use generally accepted or recognized words/terms in analysis platform dialogue windows, reports, and general user interface applications because these words have recognizable and often standard meaning to both producers and consumers of the information contained in the reports or JMP user interface items. Plus all the JMP documentation ties to these words...not words that are replaced by an individual user.


- Mark as New
- Bookmark
- Subscribe
- Mute
- Subscribe to RSS Feed
- Get Direct Link
- Report Inappropriate Content
Re: Questions about Pareto Plot of Estimates
- Mark as New
- Bookmark
- Subscribe
- Mute
- Subscribe to RSS Feed
- Get Direct Link
- Report Inappropriate Content
Re: Questions about Pareto Plot of Estimates
I understand your points. However, are there any ways that I can see let say which parameter has the greatest effect?
Sincerely,
TK


- Mark as New
- Bookmark
- Subscribe
- Mute
- Subscribe to RSS Feed
- Get Direct Link
- Report Inappropriate Content
Re: Questions about Pareto Plot of Estimates
The Pareto Plot is one of the ways to assess statistical significance and decide which effects are not null. Examine the Parameter Estimates for importance. If the experiment was designed by JMP, then JMP saved a column property for each of the continuous factors called Coding. The estimates are based on the coded levels of the continuous and categorical factors. The estimates can be used directly to assess the magnitude of their associated effect.
- Mark as New
- Bookmark
- Subscribe
- Mute
- Subscribe to RSS Feed
- Get Direct Link
- Report Inappropriate Content
Re: Questions about Pareto Plot of Estimates
This script might be useful. It creates an Effects Plot.
- Mark as New
- Bookmark
- Subscribe
- Mute
- Subscribe to RSS Feed
- Get Direct Link
- Report Inappropriate Content
Re: Questions about Pareto Plot of Estimates
Thank you very much!
- Mark as New
- Bookmark
- Subscribe
- Mute
- Subscribe to RSS Feed
- Get Direct Link
- Report Inappropriate Content
Re: Questions about Pareto Plot of Estimates
Thank you for a very good effects plot.
Would it be possible to know which equation you use to calculate effects?
Sincerely,
TK
Recommended Articles
- © 2026 JMP Statistical Discovery LLC. All Rights Reserved.
- Terms of Use
- Privacy Statement
- Contact Us