- Don’t miss your chance to experience Discovery Summit Europe at our best available rate! Early bird registration through 31 Oct.
- Graph Builder Toolbar streamlines interactive graphing. Creates shortcuts on Report and GraphBuilder Helpers toolbars. Download and install the extension.
- Subscribe to RSS Feed
- Mark Topic as New
- Mark Topic as Read
- Float this Topic for Current User
- Bookmark
- Subscribe
- Mute
- Printer Friendly Page
Discussions
Solve problems, and share tips and tricks with other JMP users.- User Community
- :
- Discussions
- :
- Q: How can I cut to connect X-axis in Graphic builder two Group X ?

- Mark as New
- Bookmark
- Subscribe
- Mute
- Subscribe to RSS Feed
- Get Direct Link
- Report Inappropriate Content
Q: How can I cut to connect X-axis in Graphic builder two Group X ?
Hi
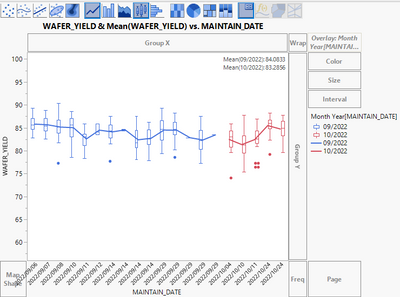
I try to draw in Graphic build and compare two groups yield by month.
As you can see below, there is a big blank between two group due to the X-axis DATE repeat shows in two group X.
How can I cut left group X-axis and right group X-axis to make them connect ?
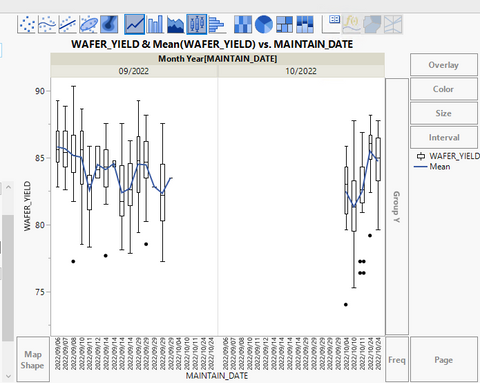
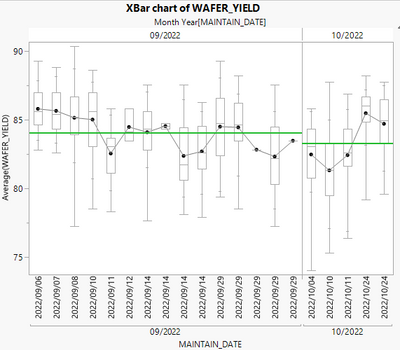
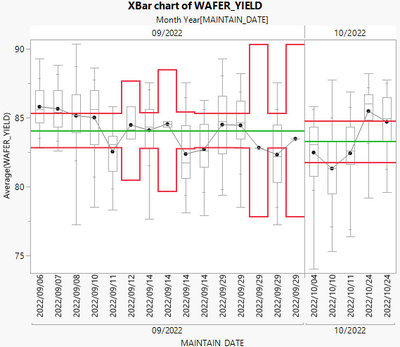
What I want is like the Xbar chart below:
Thanks you,
Regards,Chily
Accepted Solutions


- Mark as New
- Bookmark
- Subscribe
- Mute
- Subscribe to RSS Feed
- Get Direct Link
- Report Inappropriate Content
Re: Q: How can I cut to connect X-axis in Graphic builder two Group X ?
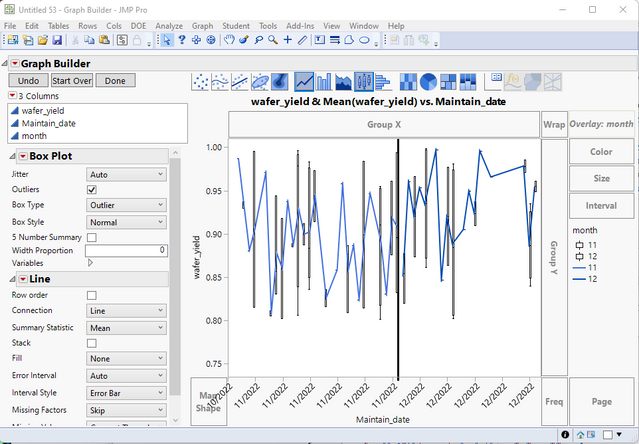
If you use an Overlay of the Month_Year column and then add a Reference Line at the breakpoint, you can get something pretty close

- Mark as New
- Bookmark
- Subscribe
- Mute
- Subscribe to RSS Feed
- Get Direct Link
- Report Inappropriate Content
Re: Q: How can I cut to connect X-axis in Graphic builder two Group X ?
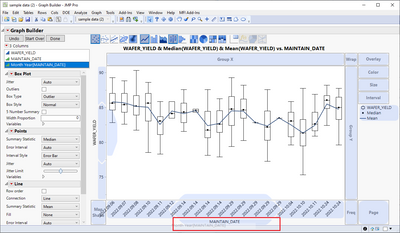
In your case it would mean adding both MAINTAIN_DATE and Month Year[MAINTAIN_DATE] to X-axis
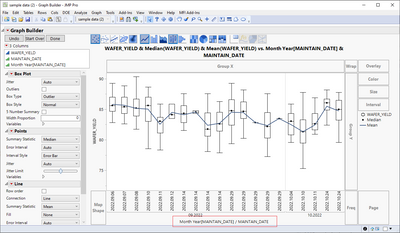
First drag and drop MAINTAIN_DATE and then drag and drop the other column below it to blueish part (I added red box around it)
- Mark as New
- Bookmark
- Subscribe
- Mute
- Subscribe to RSS Feed
- Get Direct Link
- Report Inappropriate Content
Re: Q: How can I cut to connect X-axis in Graphic builder two Group X ?
If you use an Overlay of the Month_Year column and then add a Reference Line at the breakpoint, you can get something pretty close
- Mark as New
- Bookmark
- Subscribe
- Mute
- Subscribe to RSS Feed
- Get Direct Link
- Report Inappropriate Content
Re: Q: How can I cut to connect X-axis in Graphic builder two Group X ?
Thanks your quickly reply txnelson.
It strike to me that I forgot to attach the sheet file (sample data.jmp) for you.
It looks OK to take your suggestion to use 'Overlay' instead of 'Group X' to draw.
Is that mean we can't draw like Xbart chart by graphic builder?
- Mark as New
- Bookmark
- Subscribe
- Mute
- Subscribe to RSS Feed
- Get Direct Link
- Report Inappropriate Content
Re: Q: How can I cut to connect X-axis in Graphic builder two Group X ?
Here is an XBar chart
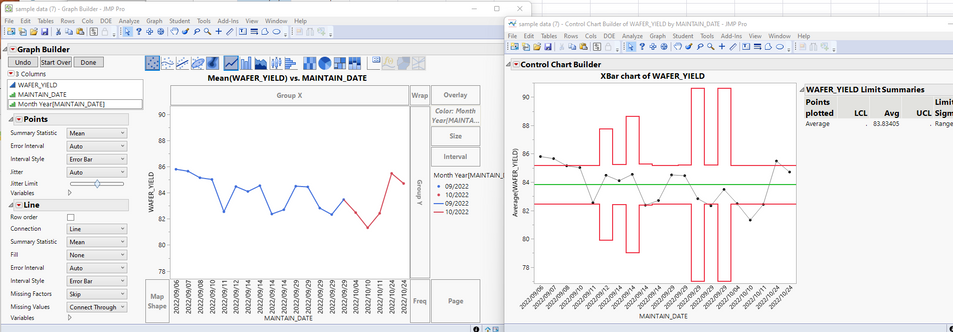
and the same chart in Graph Builder. I subgrouped based upon date
Is this what you are looking for?
- Mark as New
- Bookmark
- Subscribe
- Mute
- Subscribe to RSS Feed
- Get Direct Link
- Report Inappropriate Content
Re: Q: How can I cut to connect X-axis in Graphic builder two Group X ?
Thank you, txnelson.
Need extra seperate two group by Month like below.
It looks the control chart builder-XBar can use 'Phase' to seperate this two groups in chart,
and have respective mean line(green) in chart.
I would like to draw the same at Graphic builder since it's more flexible to add extra charts and informations.
- Mark as New
- Bookmark
- Subscribe
- Mute
- Subscribe to RSS Feed
- Get Direct Link
- Report Inappropriate Content
Re: Q: How can I cut to connect X-axis in Graphic builder two Group X ?
X group: restrict the values on the axis to the respective group is wish list item related to this. It also has one suggestion (which I would use for now) to use X-axis factor nesting instead of X-grouping.
- Mark as New
- Bookmark
- Subscribe
- Mute
- Subscribe to RSS Feed
- Get Direct Link
- Report Inappropriate Content
Re: Q: How can I cut to connect X-axis in Graphic builder two Group X ?
Thank you, jthi.
It's good to hear it already in the wish list.
could you describe the "X-axis factor nesting" mean?
- Mark as New
- Bookmark
- Subscribe
- Mute
- Subscribe to RSS Feed
- Get Direct Link
- Report Inappropriate Content
Re: Q: How can I cut to connect X-axis in Graphic builder two Group X ?
In your case it would mean adding both MAINTAIN_DATE and Month Year[MAINTAIN_DATE] to X-axis
First drag and drop MAINTAIN_DATE and then drag and drop the other column below it to blueish part (I added red box around it)
- Mark as New
- Bookmark
- Subscribe
- Mute
- Subscribe to RSS Feed
- Get Direct Link
- Report Inappropriate Content
Re: Q: How can I cut to connect X-axis in Graphic builder two Group X ?
Got it, thanks your detail explain.
Recommended Articles
- © 2026 JMP Statistical Discovery LLC. All Rights Reserved.
- Terms of Use
- Privacy Statement
- Contact Us