- JMP will suspend normal business operations for our Winter Holiday beginning on Wednesday, Dec. 24, 2025, at 5:00 p.m. ET (2:00 p.m. ET for JMP Accounts Receivable).
Regular business hours will resume at 9:00 a.m. EST on Friday, Jan. 2, 2026. - We’re retiring the File Exchange at the end of this year. The JMP Marketplace is now your destination for add-ins and extensions.
- Subscribe to RSS Feed
- Mark Topic as New
- Mark Topic as Read
- Float this Topic for Current User
- Bookmark
- Subscribe
- Mute
- Printer Friendly Page
Discussions
Solve problems, and share tips and tricks with other JMP users.- JMP User Community
- :
- Discussions
- :
- Proportional hazards

- Mark as New
- Bookmark
- Subscribe
- Mute
- Subscribe to RSS Feed
- Get Direct Link
- Report Inappropriate Content
Proportional hazards
Accepted Solutions

- Mark as New
- Bookmark
- Subscribe
- Mute
- Subscribe to RSS Feed
- Get Direct Link
- Report Inappropriate Content
Re: How to make adjusted survival curve?
Please see Help > Books > Reliability and Survival > Chapter 15: Fit Proportional Hazards.
See also Help > Sample Data > Reliability/Survival > VA Lung Cancer data table. Run the saved Fit Proportional Hazards table script to see an example of the Baseline Survival at the Mean plot.
- Mark as New
- Bookmark
- Subscribe
- Mute
- Subscribe to RSS Feed
- Get Direct Link
- Report Inappropriate Content
Re: How to make adjusted survival curve?
I do not know what you mean by 'adjusted survival curve.'
I interpret your question to mean that you want to fit a sample of life data from two populations to a distribution model.
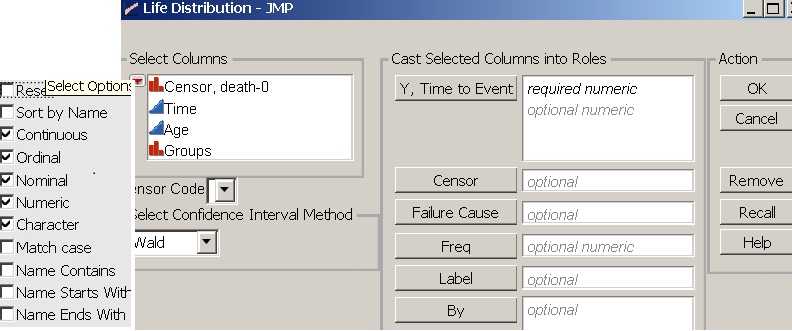
- Select Analyze > Reliability and Survival > Life Distribution.
- Select the Compare Groups tab at the top of the dialog.
- Select the data column with the life data and click Y, Time to Event.
- Select the data column with the groups and click Grouping.
- If you have censoring, select the data column with the exact/censored indicator and click Censor. Then select the censor code.
- Click OK.
- Click the red triangle next to Life Distribution and select Show Survival Curve.
- Select a Distribution model and appropriate Scale (e.g., lognormal).
Please see Help > Books > Reliability and Survival > Chapter 3: Life Distribution for more details. See also other chapters for the Survival, Fit Parametric Survival, and Fit Proportional Hazards platforms in case you need such analyses.
- Mark as New
- Bookmark
- Subscribe
- Mute
- Subscribe to RSS Feed
- Get Direct Link
- Report Inappropriate Content
Re: How to make adjusted survival curve?
Excuse me: I clarify the question. There are two groups of patients unbalanced by age: in one of them mostly young, in the other - mostly older. How to make adjusted (by age) Kaplan-Meier curves?
P.S. In any case: where is Compare Groups tab?
- Mark as New
- Bookmark
- Subscribe
- Mute
- Subscribe to RSS Feed
- Get Direct Link
- Report Inappropriate Content
Re: How to make adjusted survival curve?
Do you want to compare the survival of the two groups, account for patient age (covariate), or both?
The Compare Groups tab is in the launch dialog for Life Distribution. You should see it as you followed my detailed instructions.
- Mark as New
- Bookmark
- Subscribe
- Mute
- Subscribe to RSS Feed
- Get Direct Link
- Report Inappropriate Content
Re: How to make adjusted survival curve?
I would like to obtain Kaplan-Meier curves (for two groups), taking into account the method of which it is said: "Adjusted survival curves are often presented in medical research articles. The most commonly used method for calculating such curves is the mean of covariates method, in which average values of covariates are entered into a proportional hazards regression equation."
- Mark as New
- Bookmark
- Subscribe
- Mute
- Subscribe to RSS Feed
- Get Direct Link
- Report Inappropriate Content
Re: How to make adjusted survival curve?
Please see Help > Books > Reliability and Survival > Chapter 15: Fit Proportional Hazards.
See also Help > Sample Data > Reliability/Survival > VA Lung Cancer data table. Run the saved Fit Proportional Hazards table script to see an example of the Baseline Survival at the Mean plot.
Recommended Articles
- © 2025 JMP Statistical Discovery LLC. All Rights Reserved.
- Terms of Use
- Privacy Statement
- Contact Us