- JMP will suspend normal business operations for our Winter Holiday beginning on Wednesday, Dec. 24, 2025, at 5:00 p.m. ET (2:00 p.m. ET for JMP Accounts Receivable).
Regular business hours will resume at 9:00 a.m. EST on Friday, Jan. 2, 2026. - We’re retiring the File Exchange at the end of this year. The JMP Marketplace is now your destination for add-ins and extensions.
- Subscribe to RSS Feed
- Mark Topic as New
- Mark Topic as Read
- Float this Topic for Current User
- Bookmark
- Subscribe
- Mute
- Printer Friendly Page
Discussions
Solve problems, and share tips and tricks with other JMP users.- JMP User Community
- :
- Discussions
- :
- Process control graph layout with multiple y variables with limits on one graph
- Mark as New
- Bookmark
- Subscribe
- Mute
- Subscribe to RSS Feed
- Get Direct Link
- Report Inappropriate Content
Process control graph layout with multiple y variables with limits on one graph
Hello,
I am new user of jump.
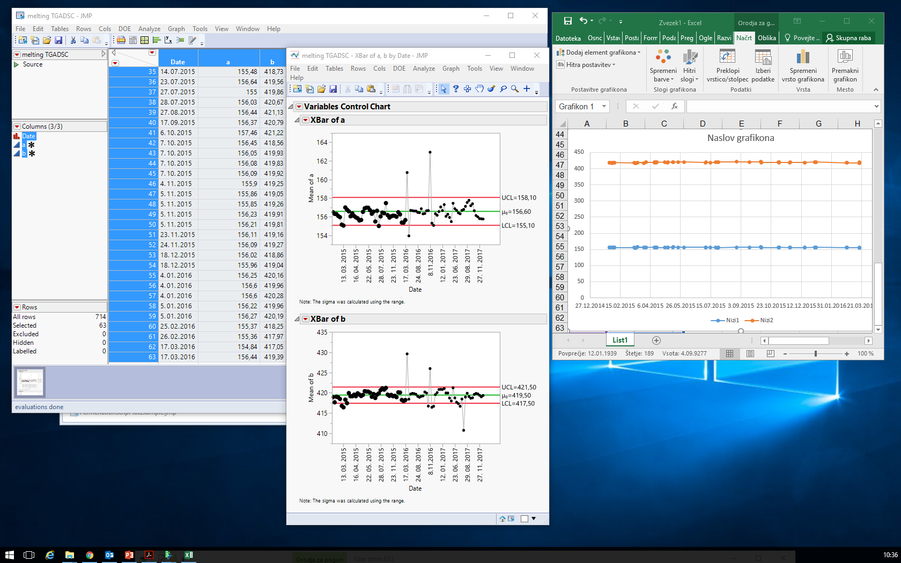
I have a and b variables that are the same parameter type, but have different control limits. I want to built the process control chart that contains both variables on the same graph in order to spare some space.
Using x bar in process and control, I can easily built two separate control charts (shown on the left of the image bellow) with all the informations needed.
However, I can not find out how to combine those two diagrams in one, like it is shown on the right side of the image (limits are missing). Can somebody tell me how to do that in jmp, please (I have version 13.1)?
Thank you very much for your help!
- Mark as New
- Bookmark
- Subscribe
- Mute
- Subscribe to RSS Feed
- Get Direct Link
- Report Inappropriate Content
Re: Process control graph layout with multiple y variables with limits on one graph
There is not a direct way to place 2 "Control Chart" in the same graph in JMP, however you can easily replicate your right hand chart using Chart Builder, and then add reference lines for the USL, LSL and Target for the separate. Below is an example, using the Big Class sample data table.
- Mark as New
- Bookmark
- Subscribe
- Mute
- Subscribe to RSS Feed
- Get Direct Link
- Report Inappropriate Content
Re: Process control graph layout with multiple y variables with limits on one graph
Maybe as an alternative display workflow is to use a 2x1 Dashboard template. This is only available beginning in JMP 13, but it might give you the 'look' you are after?
- Mark as New
- Bookmark
- Subscribe
- Mute
- Subscribe to RSS Feed
- Get Direct Link
- Report Inappropriate Content
Re: Process control graph layout with multiple y variables with limits on one graph
here's how to do it
https://community.jmp.com/t5/Byron-Wingerd-s-Blog/Multiple-Y-Axis-Graphs/ba-p/52000
Recommended Articles
- © 2025 JMP Statistical Discovery LLC. All Rights Reserved.
- Terms of Use
- Privacy Statement
- Contact Us


