- Subscribe to RSS Feed
- Mark Topic as New
- Mark Topic as Read
- Float this Topic for Current User
- Bookmark
- Subscribe
- Mute
- Printer Friendly Page
Discussions
Solve problems, and share tips and tricks with other JMP users.- JMP User Community
- :
- Discussions
- :
- Re: Process Screening on I-MR, control limits from within stdev?

- Mark as New
- Bookmark
- Subscribe
- Mute
- Subscribe to RSS Feed
- Get Direct Link
- Report Inappropriate Content
Process Screening on I-MR, control limits from within stdev?
Simple question. Just curious if the within stdev on the IMR version is used for limits (in the absence of a specified sigma). I'm 99% sure they are, just wanted to confirm, and didn't see this in the process screening report notes.
Accepted Solutions

- Mark as New
- Bookmark
- Subscribe
- Mute
- Subscribe to RSS Feed
- Get Direct Link
- Report Inappropriate Content
Re: Process Screening on I-MR, control limits from within stdev?
If you use the Control Chart Type specification of Indiv and MR in Process Screening, the limits will be calculated using within sigma (average(moving ranges)/d2(n)) the same as Control Chart Builder does. You can find the calculations here:
- Mark as New
- Bookmark
- Subscribe
- Mute
- Subscribe to RSS Feed
- Get Direct Link
- Report Inappropriate Content
Re: Process Screening on I-MR, control limits from within stdev?
Thanks Tonya, I was 99% sure that was the case but wanted to confirm.
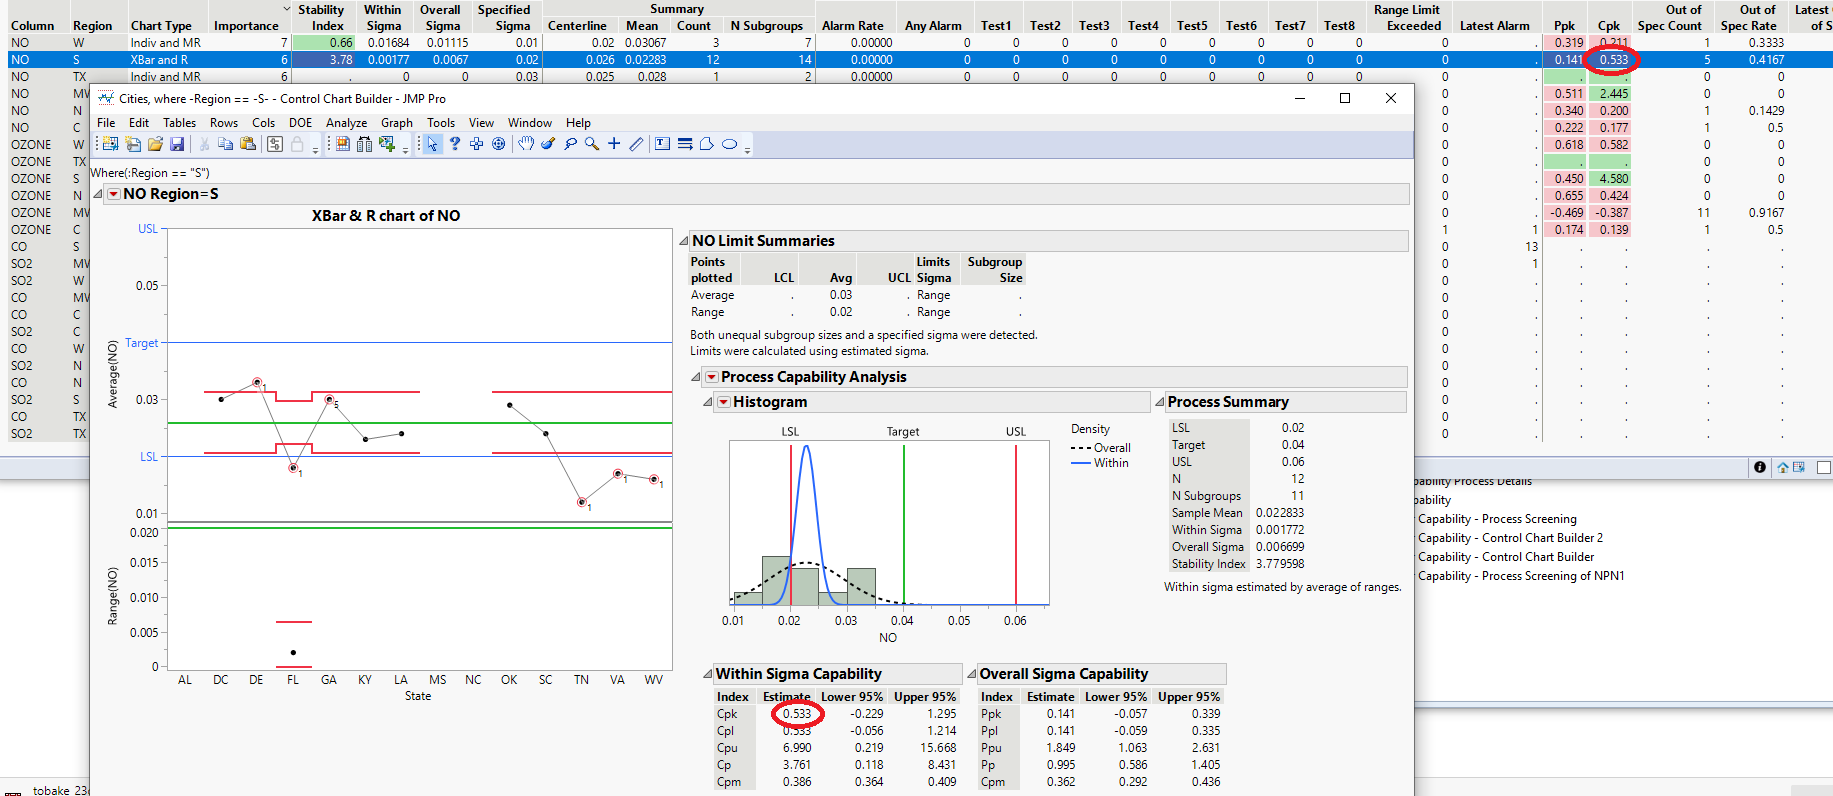
One small other thing I noticed, though I would mention since I have you. Kind of an interesting blip. The Cp in Process Screening uses the within sigma, even if there is a specified sigma, however if you punt to the control chart platform from the Process Screening tool the Cp will use the specified sigma instead of the within.
- Mark as New
- Bookmark
- Subscribe
- Mute
- Subscribe to RSS Feed
- Get Direct Link
- Report Inappropriate Content
Re: Process Screening on I-MR, control limits from within stdev?
Please send an example of Cp not matching between Process Screening and Control Chart Builder. I ran the following code and got them to match.
dt=Open("$Sample_Data/Cities.jmp");
dtLimits=New Table( "My Limits",
	Add Rows( 13 ),
	New Column( "Process",
		Character,
		"Nominal",
		Set Values(
			{"OZONE", "NO", "OZONE", "OZONE", "OZONE", "OZONE", "OZONE", "NO", "NO",
			"NO", "NO", "NO", "NO"}
		)
	),
	New Column( "LSL",
		Numeric,
		"Continuous",
		Format( "Best", 12 ),
		Set Values(
			[0.1, 0.02, 0.2, 0.1, 0.1, 0.1, 0.1, 0.02, 0.02, 0.02, 0.02, 0.02, 0.02]
		)
	),
	New Column( "Target",
		Numeric,
		"Continuous",
		Format( "Best", 12 ),
		Set Values(
			[0.2, 0.04, 0.3, 0.2, 0.2, 0.2, 0.2, 0.04, 0.04, 0.04, 0.04, 0.04, 0.04]
		)
	),
	New Column( "USL",
		Numeric,
		"Continuous",
		Format( "Best", 12 ),
		Set Values(
			[0.3, 0.06, 0.4, 0.3, 0.3, 0.3, 0.3, 0.06, 0.06, 0.06, 0.06, 0.06, 0.06]
		)
	),
	New Column( "Grouping",
		Character,
		"Nominal",
		Set Values(
			{"C", "C", "MW", "N", "S", "TX", "W", "C", "MW", "N", "S", "TX", "W"}
		)
	),
	New Column( "Center",
		Numeric,
		"Continuous",
		Format( "Best", 12 ),
		Set Values(
			[0.2, 0.04, 0.15, 0.16, 0.13, 0.2, 0.12, 0.04, 0.026, 0.035, 0.026,
			0.025, 0.02]
		)
	),
	New Column( "Sigma",
		Numeric,
		"Continuous",
		Format( "Best", 12 ),
		Set Values(
			[0.05, 0.01, 0.05, 0.04, 0.06, 0.05, 0.05, 0.01, 0.01, 0.01, 0.02, 0.03,
			0.01]
		)
	),
	New Column( "Importance",
		Numeric,
		"Continuous",
		Format( "Best", 12 ),
		Set Values( [1, 4, 1, 2, 2, 3, 3, 4, 5, 5, 6, 6, 7] )
	),
	Set Label Columns( :Process )
);

obj=dt<<Process Screening(
	Y( :OZONE, :CO, :SO2, :NO ),
	Grouping( :Region ),
	Control Chart Type( "XBar and R" ),
	Subgroup( :State ),
	Minimum Process Length( 1 ),
	Test 2( 1 ),
	Test 3( 1 ),
	Test 4( 1 ),
	Test 5( 1 ),
	Test 6( 1 ),
	Test 7( 1 ),
	Test 8( 1 ),
	Range Limit Exceeded( 1 ),
	Use Limits Table(
		1,
		Data Table( "My Limits" ),
		Process Variables( :Process ),
		Center( :Center ),
		Sigma( :Sigma ),
		LSL( :LSL ),
		USL( :USL ),
		Target( :Target ),
		Importance( :Importance ),
		Grouping( :Grouping),
		Go
	)
);

obj<<Find and Select ("NO", "S");
obj<<Control Charts for Selected Items;
See attached image.
- Mark as New
- Bookmark
- Subscribe
- Mute
- Subscribe to RSS Feed
- Get Direct Link
- Report Inappropriate Content
Re: Process Screening on I-MR, control limits from within stdev?
Tonya
Aha! I figured it out. Very interesting, it bothered me because we had nearly identical scripts.
Here's the trick. Don't specify sigma for 100% of your variables. If you have a couple process variables without a specified sigma, it will use the within for ALL of your variables in process screening. Which makes some sense from a programming perspective as I'm guessing the calculations are happening on the columns, so the specified sigma has some/any nulls in it it defaults to the within column.
Here, I removed the specified sigma for a few of your variables in the script you provided. But the one that makes the control chart does still have a specified sigma, so what shows up in the control chart is different than what is in Process Screening:
dt=Open("$Sample_Data/Cities.jmp");
dtLimits=New Table( "My Limits",
	Add Rows( 13 ),
	New Column( "Process",
		Character,
		"Nominal",
		Set Values(
			{"OZONE", "NO", "OZONE", "OZONE", "OZONE", "OZONE", "OZONE", "NO", "NO",
			"NO", "NO", "NO", "NO"}
		)
	),
	New Column( "LSL",
		Numeric,
		"Continuous",
		Format( "Best", 12 ),
		Set Values(
			[0.1, 0.02, 0.2, 0.1, 0.1, 0.1, 0.1, 0.02, 0.02, 0.02, 0.02, 0.02, 0.02]
		)
	),
	New Column( "Target",
		Numeric,
		"Continuous",
		Format( "Best", 12 ),
		Set Values(
			[0.2, 0.04, 0.3, 0.2, 0.2, 0.2, 0.2, 0.04, 0.04, 0.04, 0.04, 0.04, 0.04]
		)
	),
	New Column( "USL",
		Numeric,
		"Continuous",
		Format( "Best", 12 ),
		Set Values(
			[0.3, 0.06, 0.4, 0.3, 0.3, 0.3, 0.3, 0.06, 0.06, 0.06, 0.06, 0.06, 0.06]
		)
	),
	New Column( "Grouping",
		Character,
		"Nominal",
		Set Values(
			{"C", "C", "MW", "N", "S", "TX", "W", "C", "MW", "N", "S", "TX", "W"}
		)
	),
	New Column( "Center",
		Numeric,
		"Continuous",
		Format( "Best", 12 ),
		Set Values(
			[0.2, 0.04, 0.15, 0.16, 0.13, 0.2, 0.12, 0.04, 0.026, 0.035, 0.026,
			0.025, 0.02]
		)
	),
	New Column( "Sigma",
		Numeric,
		"Continuous",
		Format( "Best", 12 ),
		Set Values(
			[0.05, 0.01, 0.05, 0.04, 0.06, 0.05, 0.05, 0.01, 0.01, 0.01]
		)
	),
	New Column( "Importance",
		Numeric,
		"Continuous",
		Format( "Best", 12 ),
		Set Values( [1, 4, 1, 2, 2, 3, 3, 4, 5, 5, 6, 6, 7] )
	),
	Set Label Columns( :Process )
);

obj=dt<<Process Screening(
	Y( :OZONE, :CO, :SO2, :NO ),
	Grouping( :Region ),
	Control Chart Type( "XBar and R" ),
	Subgroup( :State ),
	Minimum Process Length( 1 ),
	Test 2( 1 ),
	Test 3( 1 ),
	Test 4( 1 ),
	Test 5( 1 ),
	Test 6( 1 ),
	Test 7( 1 ),
	Test 8( 1 ),
	Range Limit Exceeded( 1 ),
	Use Limits Table(
		1,
		Data Table( "My Limits" ),
		Process Variables( :Process ),
		Center( :Center ),
		Sigma( :Sigma ),
		LSL( :LSL ),
		USL( :USL ),
		Target( :Target ),
		Importance( :Importance ),
		Grouping( :Grouping),
		Go
	)
);

obj<<Find and Select ("NO", "S");
obj<<Control Charts for Selected Items;
- Mark as New
- Bookmark
- Subscribe
- Mute
- Subscribe to RSS Feed
- Get Direct Link
- Report Inappropriate Content
Re: Process Screening on I-MR, control limits from within stdev?
This is a problem with the Control Chart Builder Code that Process Screening is running behind the scenes. Development has been made aware of the problem.
Thank you for including the example.
Recommended Articles
- © 2026 JMP Statistical Discovery LLC. All Rights Reserved.
- Terms of Use
- Privacy Statement
- Contact Us