- New to JMP? Join us Sept. 23-24 for the Early User Edition of Discovery Summit, tailor-made for new users. Register now for free!
- Your voice matters! Tell us how you prefer to receive JMP updates, so we can tailor our communication to your needs. Take short survey.
- See how to access JMP Marketplace - and - find, create & share add-ins to extend your JMP. Watch video.
- Subscribe to RSS Feed
- Mark Topic as New
- Mark Topic as Read
- Float this Topic for Current User
- Bookmark
- Subscribe
- Mute
- Printer Friendly Page
Discussions
Solve problems, and share tips and tricks with other JMP users.- JMP User Community
- :
- Discussions
- :
- Possible to add automatic graph creation in JSL script?

- Mark as New
- Bookmark
- Subscribe
- Mute
- Subscribe to RSS Feed
- Get Direct Link
- Report Inappropriate Content
Possible to add automatic graph creation in JSL script?
Hello,
I wrote a JSL to organize experimental data which updates 22 data tables (corresponding to products), each containing columns for different physicochemical parameters (e.g. pH, osmolality). Currently, I am manually creating graphs using the Graph Builder feature and 'saving script to data table', however I was wondering if it was possible to write this into the main JSL script that is generating my data tables?
Each graph displays a particular parameter on the y-axis, and time on the x-axis, so I want to write code that generates graphs in each data table for each parameter, rather than having to manually make the graphs and save the script.
Accepted Solutions

- Mark as New
- Bookmark
- Subscribe
- Mute
- Subscribe to RSS Feed
- Get Direct Link
- Report Inappropriate Content
Re: Possible to add automatic graph creation in JSL script?
Hi @DanAlexander,
I second @txnelson that checking the JSL Scripting Guide would really be useful given the complexity of what you are trying to do.
But to get you started, here is an example that attempts to do something similar to what you described.
The "setup" function creates a few data views from the sample data "CrimeData.jmp" file, to simulate your product subsets, and associates them with different subset of the table columns.
The "build_graphs" shows how to use JSL to create graphs from a template. It is a simple matter of using variable substitution.
The graphs are combined in a single window using a V List Box.
I hope this is helpful!
- Mark as New
- Bookmark
- Subscribe
- Mute
- Subscribe to RSS Feed
- Get Direct Link
- Report Inappropriate Content
Re: Possible to add automatic graph creation in JSL script?

- Mark as New
- Bookmark
- Subscribe
- Mute
- Subscribe to RSS Feed
- Get Direct Link
- Report Inappropriate Content
Re: Possible to add automatic graph creation in JSL script?
- Mark as New
- Bookmark
- Subscribe
- Mute
- Subscribe to RSS Feed
- Get Direct Link
- Report Inappropriate Content
Re: Possible to add automatic graph creation in JSL script?
Hi Jim,
This is an example of a graph builder script in my program:
Graph Builder(
	Size( 1263, 901 ),
	Variables(
		X( :Name( "Time (Months)" ) ),
		Y( :Name( "% Adsorption" ) ),
		Overlay( :Lot Number )
	),
	Elements(
		Points( X, Y, Legend( 13 ) ),
		Line Of Fit( X, Y, Legend( 15 ), Confidence of Fit( 0 ) )
	));
My concern is that due to the size of my script, I would have to write 100+ iterations of the above script to cover all different data tables and y-axis parameters. I was wondering if I could create a list of all the y-axis parameters and call upon that list in the above script?
My main script basically sorts a raw data database into 22 'product subset' data tables, each of which is specific for a particular product. There are about 30 different physicochemical parameters, each of which needs to have a separate graph vs. time. However, not every parameter applies to every product. I.e. a particular data table may only contain 10 of the 30 parameters.
- Mark as New
- Bookmark
- Subscribe
- Mute
- Subscribe to RSS Feed
- Get Direct Link
- Report Inappropriate Content
Re: Possible to add automatic graph creation in JSL script?
If you haven't read the Scripting Guide, it is now the time to do so.
- Mark as New
- Bookmark
- Subscribe
- Mute
- Subscribe to RSS Feed
- Get Direct Link
- Report Inappropriate Content
Re: Possible to add automatic graph creation in JSL script?
I'm just wondering, it may be possible to do this using the 'For each row' function, if each row corresponds to a different y-axis parameter like you said.
- Mark as New
- Bookmark
- Subscribe
- Mute
- Subscribe to RSS Feed
- Get Direct Link
- Report Inappropriate Content
Re: Possible to add automatic graph creation in JSL script?
Hi @DanAlexander,
I second @txnelson that checking the JSL Scripting Guide would really be useful given the complexity of what you are trying to do.
But to get you started, here is an example that attempts to do something similar to what you described.
The "setup" function creates a few data views from the sample data "CrimeData.jmp" file, to simulate your product subsets, and associates them with different subset of the table columns.
The "build_graphs" shows how to use JSL to create graphs from a template. It is a simple matter of using variable substitution.
The graphs are combined in a single window using a V List Box.
I hope this is helpful!
- Mark as New
- Bookmark
- Subscribe
- Mute
- Subscribe to RSS Feed
- Get Direct Link
- Report Inappropriate Content
Re: Possible to add automatic graph creation in JSL script?
Thank you for sharing the example script with the Setup and Build-graphs functions. I was able to adapt these functions for my script successfully!
I was wondering, is it possible to save the graph window as a separate file in the same directory as my data tables? I use the 'Close' function throughout my script to save the different data tables, but I am unsure how to use the function to save the graph windows generated using V List Box in the 'Build_graphs' function.
For example throughout my script I have variations of:
Close( dtProduct, Save( save_path_example || "dtProduct.JMP"));- Mark as New
- Bookmark
- Subscribe
- Mute
- Subscribe to RSS Feed
- Get Direct Link
- Report Inappropriate Content
Re: Possible to add automatic graph creation in JSL script?
Hi there,
Yes, you sure can. I didn't know how but a quick look in the available options for the Window Object in the Scripting Index pointed me to the "Save Window Report" function.
Please see the attached file. It fixes a bug in the build_graphs function (it was not returning the window reference) and adds the following line to the end of the script:
win << Save Window Report( "automated_gb2.jrp", embed data( 1 ) );- Mark as New
- Bookmark
- Subscribe
- Mute
- Subscribe to RSS Feed
- Get Direct Link
- Report Inappropriate Content
Re: Possible to add automatic graph creation in JSL script?
Hi,
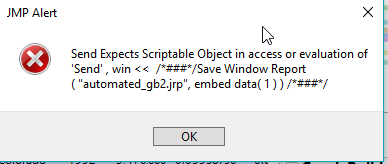
I tried using the 'Save Window Report' function, however the script is giving the error in the attached image. Also strangely I did not find that function in the Scripting index for Window Object.
The error reads as follows: 'Send Expects Scriptable Object in access or evaluation of 'Send' ,win << /*###*/Save Window Report ("automated_gb2.jrp", embed data(1)) /*###*/
- Mark as New
- Bookmark
- Subscribe
- Mute
- Subscribe to RSS Feed
- Get Direct Link
- Report Inappropriate Content
Re: Possible to add automatic graph creation in JSL script?
1) I made a change to build_graphs, the first version was not returning the window reference. Did you update yours?
2) What version of JMP you're using?
Recommended Articles
- © 2026 JMP Statistical Discovery LLC. All Rights Reserved.
- Terms of Use
- Privacy Statement
- Contact Us