cancel
Showing results for 
Show  only  | Search instead for 
Did you mean: 

Discussions

Solve problems, and share tips and tricks with other JMP users.
%3CLINGO-SUB%20id%3D%22lingo-sub-44866%22%20slang%3D%22en-US%22%20mode%3D%22NONE%22%3EPlotting%20lower%20%2F%20upper%20limits%20and%20average%20in%20a%20control%20chart%3C%2FLINGO-SUB%3E%3CLINGO-BODY%20id%3D%22lingo-body-44866%22%20slang%3D%22en-US%22%20mode%3D%22NONE%22%3E%3CP%3EHi%20guys%2C%3C%2FP%3E%3CP%3E%26nbsp%3B%3C%2FP%3E%3CP%3EI%20would%20like%20to%20know%20if%20it%20is%20possible%20to%20plot%20the%20lower%20%2C%20upper%20and%20average%20values%20direct%20in%20the%20control%20chart%20(created%20by%26nbsp%3Bcontrol%20chart%20builder)%26nbsp%3Binstead%20of%20Show%20Limit%20Summaries%20table.%3C%2FP%3E%3CP%3EThanks.%3C%2FP%3E%3C%2FLINGO-BODY%3E%3CLINGO-SUB%20id%3D%22lingo-sub-45123%22%20slang%3D%22en-US%22%20mode%3D%22NONE%22%3ERe%3A%20Plotting%20lower%20%2F%20upper%20limits%20and%20average%20in%20a%20control%20chart%3C%2FLINGO-SUB%3E%3CLINGO-BODY%20id%3D%22lingo-body-45123%22%20slang%3D%22en-US%22%20mode%3D%22NONE%22%3EThank%20you%2CJim.%20It%20works%20now!%3C%2FLINGO-BODY%3E%3CLINGO-SUB%20id%3D%22lingo-sub-45122%22%20slang%3D%22en-US%22%20mode%3D%22NONE%22%3ERe%3A%20Plotting%20lower%20%2F%20upper%20limits%20and%20average%20in%20a%20control%20chart%3C%2FLINGO-SUB%3E%3CLINGO-BODY%20id%3D%22lingo-body-45122%22%20slang%3D%22en-US%22%20mode%3D%22NONE%22%3E%3CP%3EThe%20syntax%20of%20the%20%22Summarize()%22%20function%20has%20changed%20in%20the%20recent%20versions%20of%20JMP.%20%26nbsp%3BIt%20seems%20that%20might%20be%20the%20issue.%20%26nbsp%3BChange%20the%20statement%3C%2FP%3E%0A%3CP%3E%26nbsp%3B%20%26nbsp%3B%20%26nbsp%3B%3CSPAN%3ESummarize(%20dt%2C%20byPhase%20%3D%20by(%20%3AMyPhase%20)%20)%3B%3C%2FSPAN%3E%3C%2FP%3E%0A%3CP%3E%3CSPAN%3Eto%3C%2FSPAN%3E%3C%2FP%3E%0A%3CP%3E%3CSPAN%3E%26nbsp%3B%20%26nbsp%3B%20%26nbsp%3BSummarize(%20%26nbsp%3BbyPhase%20%3D%20by(%20%3AMyPhase%20)%20)%3B%3C%2FSPAN%3E%3C%2FP%3E%3C%2FLINGO-BODY%3E%3CLINGO-SUB%20id%3D%22lingo-sub-45113%22%20slang%3D%22en-US%22%20mode%3D%22NONE%22%3ERe%3A%20Plotting%20lower%20%2F%20upper%20limits%20and%20average%20in%20a%20control%20chart%3C%2FLINGO-SUB%3E%3CLINGO-BODY%20id%3D%22lingo-body-45113%22%20slang%3D%22en-US%22%20mode%3D%22NONE%22%3EThank%20you.%20I%20checked%20in%20English%20pickle%20sample%20data%20still%20no%20success.%20I%20step%20to%20step%20to%20run%20the%20scrip%20and%20get%20the%20following%20report%20after%20i%20run%20Summarize(%20dt%2F*%23%23%23*%2F%2C%20byPhase%20%3D%20by(%20%3AMyPhase%20)%20).%20I%20translate%20the%20log%20into%20English%20for%20you.%20Do%20you%20believe%20there%20is%20some%20wrong%20there%3F%3CBR%20%2F%3E%3CBR%20%2F%3E%E5%BF%85%E9%A1%BB%E6%98%AF%E8%B5%8B%E5%80%BC%E8%BF%90%E7%AE%97%E7%AC%A6%20%E6%AD%A3%E5%9C%A8%E8%AE%BF%E9%97%AE%E6%88%96%E8%AE%A1%E7%AE%97%E2%80%9Cdt%E2%80%9D%2C%20dt%2F*%23%23%23*%2F%3CBR%20%2F%3EMust%20use%20assignment%20operator%20in%20visiting%20%22dt%22%3CBR%20%2F%3E%E5%9C%A8%E4%BB%A5%E4%B8%8B%E8%84%9A%E6%9C%AC%E4%B8%AD%EF%BC%8C%E4%BD%BF%E7%94%A8%20%2F*%23%23%23*%2F%20%E6%A0%87%E8%AE%B0%E9%94%99%E8%AF%AF%3CBR%20%2F%3Ein%20the%20following%20script%2C%20use%20%2F*%23%23%23*%2F%20to%20mark%20error%3CBR%20%2F%3E%3C%2FLINGO-BODY%3E%3CLINGO-SUB%20id%3D%22lingo-sub-45070%22%20slang%3D%22en-US%22%20mode%3D%22NONE%22%3ERe%3A%20Plotting%20lower%20%2F%20upper%20limits%20and%20average%20in%20a%20control%20chart%3C%2FLINGO-SUB%3E%3CLINGO-BODY%20id%3D%22lingo-body-45070%22%20slang%3D%22en-US%22%20mode%3D%22NONE%22%3E%3CP%3EThe%20script%20is%20looking%20for%20a%20specific%20Outline%20Box%20with%20the%20title%2C%20in%20English%2C%20of%20%22Individual%20Measurement%20of%20Acid%22.%26nbsp%3B%20Your%20output%20is%20obviously%20not%20in%20English.%26nbsp%3B%26nbsp%3BThe%20below%20script%20changes%20the%20reference%20to%20Outline%20Box(2).%26nbsp%3B%20This%20is%20an%20absolute%20reference%20to%20the%20outline%20box%2C%20while%20%22Individual%20Measurement%20of%20Acid%22%20is%20a%20relative%20reference.%26nbsp%3B%20You%20could%20also%20try%20replacing%20%22Individual%20Measurement%20of%20Acid%22%20with%3C%2FP%3E%0A%3CP%3E%3CSPAN%20class%3D%22lia-inline-image-display-wrapper%20lia-image-align-inline%22%20image-alt%3D%22chinese.GIF%22%20style%3D%22width%3A%20219px%3B%22%3E%3CSPAN%20class%3D%22lia-inline-image-display-wrapper%22%20image-alt%3D%22chinese.GIF%22%20style%3D%22width%3A%20219px%3B%22%3E%3Cspan%20class%3D%22lia-inline-image-display-wrapper%22%20image-alt%3D%22chinese.GIF%22%20style%3D%22width%3A%20219px%3B%22%3E%3Cimg%20src%3D%22https%3A%2F%2Fcommunity.jmp.com%2Ft5%2Fimage%2Fserverpage%2Fimage-id%2F7766i73BE04C483E7A9E8%2Fimage-size%2Flarge%3Fv%3Dv2%26amp%3Bpx%3D999%22%20role%3D%22button%22%20title%3D%22chinese.GIF%22%20alt%3D%22chinese.GIF%22%20%2F%3E%3C%2Fspan%3E%3C%2FSPAN%3E%3C%2FSPAN%3E%3C%2FP%3E%0A%3CPRE%3E%3CCODE%20class%3D%22%20language-jsl%22%3ENames%20Default%20To%20Here(%201%20)%3B%0A%0A%2F%2F%20Open%20the%20sample%20data%20table%0Adt%20%3D%20Open(%20%22%24SAMPLE_DATA%5CQuality%20Control%5CPickles.jmp%22%20)%3B%0A%0A%2F%2F%20There%20isn't%20an%20adequate%20column%20to%20be%20used%20as%20a%20Phase%20column%20in%20the%20sample%0A%2F%2F%20data%20table%2C%20so%20create%20one%0Adt%20%26lt%3B%26lt%3B%20New%20Column(%20%22MyPhase%22%2C%20character%2C%20formula(%20Char(%20Floor(%20Row()%20%2F%2013%20%2B%201%20)%20)%20)%20)%3B%0A%0A%2F%2F%20Run%20the%20control%20Chart%0Act%20%3D%20dt%20%26lt%3B%26lt%3B%20Control%20Chart(%0A%20Phase(%20%3AMyPhase%20)%2C%0A%20Group%20Size(%201%20)%2C%0A%20KSigma(%203%20)%2C%0A%20Chart%20Col(%20%3AAcid%2C%20Individual%20Measurement(%20Phase%20Level(%20%221%22%20)%2C%20Phase%20Level(%20%222%22%20)%20)%2C%20Moving%20Range(%20Phase%20Level(%20%221%22%20)%2C%20Phase%20Level(%20%222%22%20)%20)%20)%0A)%3B%0A%0A%2F%2F%20Create%20a%20list%20called%20byPhase%20of%20the%20each%20of%20the%20Phase%20values%0ASummarize(%20dt%2C%20byPhase%20%3D%20by(%20%3AMyPhase%20)%20)%3B%0A%0A%2F%2F%20Find%20the%20max%20row%20for%20each%20phase%20to%20determine%20the%20X%20position%20on%20the%20chart%0A%2F%2F%20for%20the%20placement%20of%20the%20text%20values%0APhaseMaxRowList%20%3D%20%7B%7D%3B%0AFor(%20i%20%3D%201%2C%20i%20%26lt%3B%3D%20N%20Items(%20byPhase%20)%2C%20i%2B%2B%2C%0A%20Insert%20Into(%20PhaseMaxRowList%2C%20Max(%20dt%20%26lt%3B%26lt%3B%20get%20rows%20where(%20%3AMyPhase%20%3D%3D%20byPhase%5Bi%5D%20)%20)%20)%0A)%3B%0A%0A%2F%2F%20Add%20the%20text%20to%20the%20chart%0Aframebox%20%3D%20Report(%20ct%20)%5Bframe%20box(%201%20)%5D%3B%0AaddTxt%20%3D%20Expr(%0A%20%20%20framebox%20%26lt%3B%26lt%3B%20Add%20Graphics%20Script(%0A%20%20%20%20%20%20Description(%20scriptNameTBD%20)%2C%0A%20%20%20%20%20%20Text%20Color(%20%22Black%22%20)%3B%20%0A%20%20%20%20%20%20Text(%20Center%20Justified%2C%20%7BxTBD%20-%202%2C%20yTBD%20%2B%20.1%7D%2C%20txtTBD%20)%3B%0A%20%20%20%20%20%20)%3B%0A%20%20%20)%3B%0A%2F%2F%20Loop%20across%20the%20phases%20and%20add%20the%203%20text%20values%20by%20pulling%20their%20values%20from%20the%20table%0A%2F%2F%20and%20reformating%20the%20values%0AFor(%20i%20%3D%201%2C%20i%20%26lt%3B%3D%20N%20Items(%20byPhase%20)%2C%20i%2B%2B%2C%0A%20LCL%20%3D%20(Report(%20ct%20)%5BOutline%20Box(2)%5D%5BNumber%20Col%20Box(%20i%20)%5D%20%26lt%3B%26lt%3B%20get)%5B1%5D%3B%0A%20LCLtxt%20%3D%20%22LCL%3D%22%20%7C%7C%20Format(%20LCL%2C%20%22Fixed%20Dec%22%2C%205%2C%202%20)%3B%0A%20Avg%20%3D%20(Report(%20ct%20)%5BOutline%20Box(2)%5D%5BNumber%20Col%20Box(%20i%20%2B%20N%20Items(%20byPhase%20)%20)%5D%20%26lt%3B%26lt%3B%20get)%5B1%5D%3B%0A%20Avgtxt%20%3D%20%22Avg%3D%22%20%7C%7C%20Format(%20Avg%2C%20%22Fixed%20Dec%22%2C%205%2C%202%20)%3B%0A%20UCL%20%3D%20(Report(%20ct%20)%5BOutline%20Box(2)%5D%5BNumber%20Col%20Box(%20i%20%2B%20(N%20Items(%20byPhase%20)%20*%202)%20)%5D%20%26lt%3B%26lt%3B%20get)%5B1%5D%3B%0A%20UCLtxt%20%3D%20%22UCL%3D%22%20%7C%7C%20Format(%20UCL%2C%20%22Fixed%20Dec%22%2C%205%2C%202%20)%3B%0A%20%2F%2F%20Use%20a%20separate%20graphics%20script%20for%20each%20annotation%20so%20that%20they%20are%20more%20easily%20moved%20'by%20hand'%0A%20Eval(Substitute(NameExpr(addTxt)%2C%20Expr(scriptNameTBD)%2C%20%22LCL%20Text%20%22%7C%7CChar(i)%2C%20Expr(xTBD)%2C%20PhaseMaxRowList%5Bi%5D%2C%20Expr(yTBD)%2C%20LCL%2C%20Expr(txtTBD)%2C%20LCLtxt))%3B%0A%20Eval(Substitute(NameExpr(addTxt)%2C%20Expr(scriptNameTBD)%2C%20%22Avg%20Text%20%22%7C%7CChar(i)%2C%20Expr(xTBD)%2C%20PhaseMaxRowList%5Bi%5D%2C%20Expr(yTBD)%2C%20Avg%2C%20Expr(txtTBD)%2C%20Avgtxt))%3B%0A%20Eval(Substitute(NameExpr(addTxt)%2C%20Expr(scriptNameTBD)%2C%20%22UCL%20Text%20%22%7C%7CChar(i)%2C%20Expr(xTBD)%2C%20PhaseMaxRowList%5Bi%5D%2C%20Expr(yTBD)%2C%20UCL%2C%20Expr(txtTBD)%2C%20UCLtxt))%3B%0A)%3B%3C%2FCODE%3E%3C%2FPRE%3E%3C%2FLINGO-BODY%3E%3CLINGO-SUB%20id%3D%22lingo-sub-45068%22%20slang%3D%22en-US%22%20mode%3D%22NONE%22%3ERe%3A%20Plotting%20lower%20%2F%20upper%20limits%20and%20average%20in%20a%20control%20chart%3C%2FLINGO-SUB%3E%3CLINGO-BODY%20id%3D%22lingo-body-45068%22%20slang%3D%22en-US%22%20mode%3D%22NONE%22%3E%3CP%3EThe%20JSL%20is%20the%20same%20as%20you%20posted%20before.%20You%20can%20find%20the%20table%20image%20here.%20As%20you%20see%20that%20the%20text%20for%20LCL%2C%20UCL%20and%20Average%20have%20not%20been%20added.%3C%2FP%3E%3CP%3EThanks.%3C%2FP%3E%3C%2FLINGO-BODY%3E%3CLINGO-SUB%20id%3D%22lingo-sub-45066%22%20slang%3D%22en-US%22%20mode%3D%22NONE%22%3ERe%3A%20Plotting%20lower%20%2F%20upper%20limits%20and%20average%20in%20a%20control%20chart%3C%2FLINGO-SUB%3E%3CLINGO-BODY%20id%3D%22lingo-body-45066%22%20slang%3D%22en-US%22%20mode%3D%22NONE%22%3E%3CP%3EI%20have%20neither%20the%20access%20to%20JMP%2011%20or%20to%20a%20Mac%2C%20so%20I%20will%20need%20your%20help.%20%26nbsp%3BThe%20message%20is%20pointing%20to%20a%20piece%20of%20code%20that%20is%20attemping%20to%20read%20the%20LCL%20from%20the%20displayed%20output%20table.%20%26nbsp%3BCan%20you%20please%20provide%20the%20image%20of%20the%20table%20that%20was%20generated%20by%20the%20control%20chart%20that%20has%20the%20limits%20in%20it%3F%3C%2FP%3E%3C%2FLINGO-BODY%3E%3CLINGO-SUB%20id%3D%22lingo-sub-45065%22%20slang%3D%22en-US%22%20mode%3D%22NONE%22%3ERe%3A%20Plotting%20lower%20%2F%20upper%20limits%20and%20average%20in%20a%20control%20chart%3C%2FLINGO-SUB%3E%3CLINGO-BODY%20id%3D%22lingo-body-45065%22%20slang%3D%22en-US%22%20mode%3D%22NONE%22%3E%3CP%3EI%20tried%20the%20JSL%20on%20my%20Mac%20JMP%2011.%20However%20it%20seems%20still%20the%20texts%20have%20been%20successfully%20added%20into%20the%20chart.%20In%20log%20window%2C%20i%20get%20the%20following%20error%20information%20and%20said%20that%20can%20not%20caluate%20out%20%26nbsp%3Bsubscript.%20Can%20you%20give%20me%20an%20explantion%3F%3C%2FP%3E%3CP%20class%3D%22p1%22%3E%3CSTRONG%3EFor(%20i%20%3D%201%2C%20i%20%26lt%3B%3D%20N%20Items(%20byPhase%20)%2C%20i%2B%2B%2C%3C%2FSTRONG%3E%3C%2FP%3E%3CP%20class%3D%22p1%22%3E%3CSTRONG%3ELCL%20%3D%20(Report(%20ct%20)%5B%2F*%23%23%23*%2F%22Individual%20Measurement%20of%20Acid%22%5D%5BNumber%20Col%20Box(%20i%20)%3C%2FSTRONG%3E%3C%2FP%3E%3CP%20class%3D%22p1%22%3E%3CSTRONG%3E%5D%20%26lt%3B%26lt%3B%20get)%5B1%5D%3B%3C%2FSTRONG%3E%3C%2FP%3E%3CP%20class%3D%22p1%22%3E%3CSTRONG%3E%26nbsp%3B%3C%2FSTRONG%3E%3C%2FP%3E%3CP%20class%3D%22p1%22%3E%3CSTRONG%3E%3CSPAN%3E%26nbsp%3B%3C%2FSPAN%3E%3C%2FSTRONG%3E%3C%2FP%3E%3C%2FLINGO-BODY%3E%3CLINGO-SUB%20id%3D%22lingo-sub-44953%22%20slang%3D%22en-US%22%20mode%3D%22NONE%22%3ERe%3A%20Plotting%20lower%20%2F%20upper%20limits%20and%20average%20in%20a%20control%20chart%3C%2FLINGO-SUB%3E%3CLINGO-BODY%20id%3D%22lingo-body-44953%22%20slang%3D%22en-US%22%20mode%3D%22NONE%22%3E%3CP%3E%3CA%20href%3D%22https%3A%2F%2Fcommunity.jmp.com%2Ft5%2Fuser%2Fviewprofilepage%2Fuser-id%2F3605%22%20target%3D%22_blank%22%3E%40ian_jmp%3C%2FA%3E%3C%2FP%3E%0A%3CP%3EVery%20nice%20addition!%3C%2FP%3E%3C%2FLINGO-BODY%3E%3CLINGO-SUB%20id%3D%22lingo-sub-44946%22%20slang%3D%22en-US%22%20mode%3D%22NONE%22%3ERe%3A%20Plotting%20lower%20%2F%20upper%20limits%20and%20average%20in%20a%20control%20chart%3C%2FLINGO-SUB%3E%3CLINGO-BODY%20id%3D%22lingo-body-44946%22%20slang%3D%22en-US%22%20mode%3D%22NONE%22%3E%3CP%3EVery%20nice%20Jim!%3C%2FP%3E%0A%3CP%3EI%20took%20the%20liberty%20of%20adding%20to%20your%20code%20so%20that%20there%20is%20a%20separate%20graphics%20script%20for%20each%20annotation%3A%3C%2FP%3E%0A%3CP%3E%3CSPAN%20class%3D%22lia-inline-image-display-wrapper%20lia-image-align-inline%22%20image-alt%3D%22Screen%20Shot%202017-09-21%20at%2009.42.20.png%22%20style%3D%22width%3A%20958px%3B%22%3E%3CSPAN%20class%3D%22lia-inline-image-display-wrapper%22%20image-alt%3D%22Screen%20Shot%202017-09-21%20at%2009.42.20.png%22%20style%3D%22width%3A%20958px%3B%22%3E%3Cspan%20class%3D%22lia-inline-image-display-wrapper%22%20image-alt%3D%22Screen%20Shot%202017-09-21%20at%2009.42.20.png%22%20style%3D%22width%3A%20958px%3B%22%3E%3Cimg%20src%3D%22https%3A%2F%2Fcommunity.jmp.com%2Ft5%2Fimage%2Fserverpage%2Fimage-id%2F7735i529B7867913FC326%2Fimage-size%2Flarge%3Fv%3Dv2%26amp%3Bpx%3D999%22%20role%3D%22button%22%20title%3D%22Screen%20Shot%202017-09-21%20at%2009.42.20.png%22%20alt%3D%22Screen%20Shot%202017-09-21%20at%2009.42.20.png%22%20%2F%3E%3C%2Fspan%3E%3C%2FSPAN%3E%3C%2FSPAN%3E%3C%2FP%3E%0A%3CP%3EThis%20makes%20it%20possible%20to%20move%20the%20annotations%20'by%20hand'%20to%20avoid%20any%20collisions%20(Right-click%20on%20the%20graphics%20box%2C%20select%20'Customize'%20and%20edit%20the%20x%20and%20y%20values%20in%20the%20scripts%20to%20taste).%3C%2FP%3E%0A%3CPRE%3E%3CCODE%20class%3D%22%20language-jsl%22%3ENames%20Default%20To%20Here(%201%20)%3B%0A%0A%2F%2F%20Open%20the%20sample%20data%20table%0Adt%20%3D%20Open(%20%22%24SAMPLE_DATA%5CQuality%20Control%5CPickles.jmp%22%20)%3B%0A%0A%2F%2F%20There%20isn't%20an%20adequate%20column%20to%20be%20used%20as%20a%20Phase%20column%20in%20the%20sample%0A%2F%2F%20data%20table%2C%20so%20create%20one%0Adt%20%26lt%3B%26lt%3B%20New%20Column(%20%22MyPhase%22%2C%20character%2C%20formula(%20Char(%20Floor(%20Row()%20%2F%2013%20%2B%201%20)%20)%20)%20)%3B%0A%0A%2F%2F%20Run%20the%20control%20Chart%0Act%20%3D%20dt%20%26lt%3B%26lt%3B%20Control%20Chart(%0A%20Phase(%20%3AMyPhase%20)%2C%0A%20Group%20Size(%201%20)%2C%0A%20KSigma(%203%20)%2C%0A%20Chart%20Col(%20%3AAcid%2C%20Individual%20Measurement(%20Phase%20Level(%20%221%22%20)%2C%20Phase%20Level(%20%222%22%20)%20)%2C%20Moving%20Range(%20Phase%20Level(%20%221%22%20)%2C%20Phase%20Level(%20%222%22%20)%20)%20)%0A)%3B%0A%0A%2F%2F%20Create%20a%20list%20called%20byPhase%20of%20the%20each%20of%20the%20Phase%20values%0ASummarize(%20dt%2C%20byPhase%20%3D%20by(%20%3AMyPhase%20)%20)%3B%0A%0A%2F%2F%20Find%20the%20max%20row%20for%20each%20phase%20to%20determine%20the%20X%20position%20on%20the%20chart%0A%2F%2F%20for%20the%20placement%20of%20the%20text%20values%0APhaseMaxRowList%20%3D%20%7B%7D%3B%0AFor(%20i%20%3D%201%2C%20i%20%26lt%3B%3D%20N%20Items(%20byPhase%20)%2C%20i%2B%2B%2C%0A%20Insert%20Into(%20PhaseMaxRowList%2C%20Max(%20dt%20%26lt%3B%26lt%3B%20get%20rows%20where(%20%3AMyPhase%20%3D%3D%20byPhase%5Bi%5D%20)%20)%20)%0A)%3B%0A%0A%2F%2F%20Add%20the%20text%20to%20the%20chart%0Aframebox%20%3D%20Report(%20ct%20)%5Bframe%20box(%201%20)%5D%3B%0AaddTxt%20%3D%20Expr(%0A%20%20%20framebox%20%26lt%3B%26lt%3B%20Add%20Graphics%20Script(%0A%20%20%20%20%20%20Description(%20scriptNameTBD%20)%2C%0A%20%20%20%20%20%20Text%20Color(%20%22Black%22%20)%3B%20%0A%20%20%20%20%20%20Text(%20Center%20Justified%2C%20%7BxTBD%20-%202%2C%20yTBD%20%2B%20.1%7D%2C%20txtTBD%20)%3B%0A%20%20%20%20%20%20)%3B%0A%20%20%20)%3B%0A%2F%2F%20Loop%20across%20the%20phases%20and%20add%20the%203%20text%20values%20by%20pulling%20their%20values%20from%20the%20table%0A%2F%2F%20and%20reformating%20the%20values%0AFor(%20i%20%3D%201%2C%20i%20%26lt%3B%3D%20N%20Items(%20byPhase%20)%2C%20i%2B%2B%2C%0A%20LCL%20%3D%20(Report(%20ct%20)%5B%22Individual%20Measurement%20of%20Acid%22%5D%5BNumber%20Col%20Box(%20i%20)%5D%20%26lt%3B%26lt%3B%20get)%5B1%5D%3B%0A%20LCLtxt%20%3D%20%22LCL%3D%22%20%7C%7C%20Format(%20LCL%2C%20%22Fixed%20Dec%22%2C%205%2C%202%20)%3B%0A%20Avg%20%3D%20(Report(%20ct%20)%5B%22Individual%20Measurement%20of%20Acid%22%5D%5BNumber%20Col%20Box(%20i%20%2B%20N%20Items(%20byPhase%20)%20)%5D%20%26lt%3B%26lt%3B%20get)%5B1%5D%3B%0A%20Avgtxt%20%3D%20%22Avg%3D%22%20%7C%7C%20Format(%20Avg%2C%20%22Fixed%20Dec%22%2C%205%2C%202%20)%3B%0A%20UCL%20%3D%20(Report(%20ct%20)%5B%22Individual%20Measurement%20of%20Acid%22%5D%5BNumber%20Col%20Box(%20i%20%2B%20(N%20Items(%20byPhase%20)%20*%202)%20)%5D%20%26lt%3B%26lt%3B%20get)%5B1%5D%3B%0A%20UCLtxt%20%3D%20%22UCL%3D%22%20%7C%7C%20Format(%20UCL%2C%20%22Fixed%20Dec%22%2C%205%2C%202%20)%3B%0A%20%2F%2F%20Use%20a%20separate%20graphics%20script%20for%20each%20annotation%20so%20that%20they%20are%20more%20easily%20moved%20'by%20hand'%0A%20Eval(Substitute(NameExpr(addTxt)%2C%20Expr(scriptNameTBD)%2C%20%22LCL%20Text%20%22%7C%7CChar(i)%2C%20Expr(xTBD)%2C%20PhaseMaxRowList%5Bi%5D%2C%20Expr(yTBD)%2C%20LCL%2C%20Expr(txtTBD)%2C%20LCLtxt))%3B%0A%20Eval(Substitute(NameExpr(addTxt)%2C%20Expr(scriptNameTBD)%2C%20%22Avg%20Text%20%22%7C%7CChar(i)%2C%20Expr(xTBD)%2C%20PhaseMaxRowList%5Bi%5D%2C%20Expr(yTBD)%2C%20Avg%2C%20Expr(txtTBD)%2C%20Avgtxt))%3B%0A%20Eval(Substitute(NameExpr(addTxt)%2C%20Expr(scriptNameTBD)%2C%20%22UCL%20Text%20%22%7C%7CChar(i)%2C%20Expr(xTBD)%2C%20PhaseMaxRowList%5Bi%5D%2C%20Expr(yTBD)%2C%20UCL%2C%20Expr(txtTBD)%2C%20UCLtxt))%3B%0A)%3B%0A%3C%2FCODE%3E%3C%2FPRE%3E%0A%3CP%3E%26nbsp%3B%3C%2FP%3E%0A%3CP%3E%26nbsp%3B%3C%2FP%3E%3C%2FLINGO-BODY%3E%3CLINGO-SUB%20id%3D%22lingo-sub-44944%22%20slang%3D%22en-US%22%20mode%3D%22NONE%22%3ERe%3A%20Plotting%20lower%20%2F%20upper%20limits%20and%20average%20in%20a%20control%20chart%3C%2FLINGO-SUB%3E%3CLINGO-BODY%20id%3D%22lingo-body-44944%22%20slang%3D%22en-US%22%20mode%3D%22NONE%22%3E%3CP%3EHere%20is%20a%20very%20rough%20script%20that%20will%20pull%20the%20values%20from%20the%20limits%20table%2C%20and%20place%20them%20on%20the%20chart.%20I%20suggest%20that%20you%20take%20the%20time%20to%20read%20the%20Scripting%20Guide%20using%20the%20code%20below%20to%20learn%20exactly%20how%20the%20code%20does%20what%20it%20does.%3C%2FP%3E%0A%3CP%3E%26nbsp%3B%20%26nbsp%3B%20%26nbsp%3BHelp%3D%3D%26gt%3BBooks%3D%3D%26gt%3BScripting%20Guide%3C%2FP%3E%0A%3CP%3E%3CSPAN%20class%3D%22lia-inline-image-display-wrapper%20lia-image-align-inline%22%20image-alt%3D%22controlchart.PNG%22%20style%3D%22width%3A%20674px%3B%22%3E%3CSPAN%20class%3D%22lia-inline-image-display-wrapper%22%20image-alt%3D%22controlchart.PNG%22%20style%3D%22width%3A%20674px%3B%22%3E%3Cspan%20class%3D%22lia-inline-image-display-wrapper%22%20image-alt%3D%22controlchart.PNG%22%20style%3D%22width%3A%20674px%3B%22%3E%3Cimg%20src%3D%22https%3A%2F%2Fcommunity.jmp.com%2Ft5%2Fimage%2Fserverpage%2Fimage-id%2F7734i0DCB2A16045F7844%2Fimage-size%2Flarge%3Fv%3Dv2%26amp%3Bpx%3D999%22%20role%3D%22button%22%20title%3D%22controlchart.PNG%22%20alt%3D%22controlchart.PNG%22%20%2F%3E%3C%2Fspan%3E%3C%2FSPAN%3E%3C%2FSPAN%3E%3C%2FP%3E%0A%3CPRE%3E%3CCODE%20class%3D%22%20language-jsl%22%3ENames%20Default%20To%20Here(%201%20)%3B%0A%0A%2F%2F%20Open%20the%20sample%20data%20table%0Adt%20%3D%20Open(%20%22%24SAMPLE_DATA%5CQuality%20Control%5CPickles.jmp%22%20)%3B%0A%0A%2F%2F%20There%20isn't%20an%20adequate%20column%20to%20be%20used%20as%20a%20Phase%20column%20in%20the%20sample%0A%2F%2F%20data%20table%2C%20so%20create%20one%0Adt%20%26lt%3B%26lt%3B%20New%20Column(%20%22MyPhase%22%2C%20character%2C%20formula(%20Char(%20Floor(%20Row()%20%2F%2013%20%2B%201%20)%20)%20)%20)%3B%0A%0A%2F%2F%20Run%20the%20control%20Chart%0Act%20%3D%20dt%20%26lt%3B%26lt%3B%20Control%20Chart(%0A%20Phase(%20%3AMyPhase%20)%2C%0A%20Group%20Size(%201%20)%2C%0A%20KSigma(%203%20)%2C%0A%20Chart%20Col(%20%3AAcid%2C%20Individual%20Measurement(%20Phase%20Level(%20%221%22%20)%2C%20Phase%20Level(%20%222%22%20)%20)%2C%20Moving%20Range(%20Phase%20Level(%20%221%22%20)%2C%20Phase%20Level(%20%222%22%20)%20)%20)%0A)%3B%0A%0A%2F%2F%20Create%20a%20list%20called%20byPhase%20of%20the%20each%20of%20the%20Phase%20values%0ASummarize(%20dt%2C%20byPhase%20%3D%20by(%20%3AMyPhase%20)%20)%3B%0A%0A%2F%2F%20Find%20the%20max%20row%20for%20each%20phase%20to%20determine%20the%20X%20position%20on%20the%20chart%0A%2F%2F%20for%20the%20placement%20of%20the%20text%20values%0APhaseMaxRowList%20%3D%20%7B%7D%3B%0AFor(%20i%20%3D%201%2C%20i%20%26lt%3B%3D%20N%20Items(%20byPhase%20)%2C%20i%2B%2B%2C%0A%20Insert%20Into(%20PhaseMaxRowList%2C%20Max(%20dt%20%26lt%3B%26lt%3B%20get%20rows%20where(%20%3AMyPhase%20%3D%3D%20byPhase%5Bi%5D%20)%20)%20)%0A)%3B%0A%0A%2F%2F%20Add%20the%20text%20to%20the%20chart%0Aframebox%20%3D%20Report(%20ct%20)%5Bframe%20box(%201%20)%5D%3B%0Aframebox%20%26lt%3B%26lt%3B%20Add%20Graphics%20Script(%0A%20Text%20Color(%20%22Black%22%20)%3B%0A%20%20%0A%20%2F%2F%20Loop%20across%20the%20phases%20and%20add%20the%203%20text%20values%20by%20pulling%20their%20values%20from%20the%20table%0A%20%2F%2F%20and%20reformating%20the%20values%0A%20For(%20i%20%3D%201%2C%20i%20%26lt%3B%3D%20N%20Items(%20byPhase%20)%2C%20i%2B%2B%2C%0A%20%20LCL%20%3D%20(Report(%20ct%20)%5B%22Individual%20Measurement%20of%20Acid%22%5D%5BNumber%20Col%20Box(%20i%20)%5D%20%26lt%3B%26lt%3B%20get)%5B1%5D%3B%0A%20%20LCLtxt%20%3D%20%22LCL%3D%22%20%7C%7C%20Format(%20LCL%2C%20%22Fixed%20Dec%22%2C%205%2C%202%20)%3B%0A%20%20Avg%20%3D%20(Report(%20ct%20)%5B%22Individual%20Measurement%20of%20Acid%22%5D%5BNumber%20Col%20Box(%20i%20%2B%20N%20Items(%20byPhase%20)%20)%5D%20%26lt%3B%26lt%3B%20get)%5B1%5D%3B%0A%20%20Avgtxt%20%3D%20%22Avg%3D%22%20%7C%7C%20Format(%20Avg%2C%20%22Fixed%20Dec%22%2C%205%2C%202%20)%3B%0A%20%20UCL%20%3D%20(Report(%20ct%20)%5B%22Individual%20Measurement%20of%20Acid%22%5D%5BNumber%20Col%20Box(%20i%20%2B%20(N%20Items(%20byPhase%20)%20*%202)%20)%5D%20%26lt%3B%26lt%3B%20get)%5B1%5D%3B%0A%20%20UCLtxt%20%3D%20%22UCL%3D%22%20%7C%7C%20Format(%20UCL%2C%20%22Fixed%20Dec%22%2C%205%2C%202%20)%3B%0A%20%0A%20%20Text(%20Center%20Justified%2C%20%7BPhaseMaxRowList%5Bi%5D%20-%202%2C%20LCL%20%2B%20.1%7D%2C%20LCLtxt%20)%3B%0A%20%20Text(%20Center%20Justified%2C%20%7BPhaseMaxRowList%5Bi%5D%20-%202%2C%20Avg%20%2B%20.1%7D%2C%20Avgtxt%20)%3B%0A%20%20Text(%20Center%20Justified%2C%20%7BPhaseMaxRowList%5Bi%5D%20-%202%2C%20UCL%20%2B%20.1%7D%2C%20UCLtxt%20)%3B%0A%20)%3B%0A)%3B%3C%2FCODE%3E%3C%2FPRE%3E%3C%2FLINGO-BODY%3E%3CLINGO-SUB%20id%3D%22lingo-sub-44892%22%20slang%3D%22en-US%22%20mode%3D%22NONE%22%3ERe%3A%20Plotting%20lower%20%2F%20upper%20limits%20and%20average%20in%20a%20control%20chart%3C%2FLINGO-SUB%3E%3CLINGO-BODY%20id%3D%22lingo-body-44892%22%20slang%3D%22en-US%22%20mode%3D%22NONE%22%3E%3CP%3EHi%20again%2C%3C%2FP%3E%3CP%3ESo%2C%20the%20old%20software%20that%20I%20used%20in%20the%20past%20is%20Minitab.%3C%2FP%3E%3CP%3EAnswering%20your%20question%2C%20the%20values%20are%20ploted%20automatically%20from%20the%20software%20and%20also%20by%20phase%20(see%20the%20picture%20below).%3C%2FP%3E%3CP%3EIn%20the%20example%20that%20I%20shared%20before%2C%20there%20isn't%20phases.%3C%2FP%3E%3CP%3EI%20know%20I've%20assked%20too%20much%20but%20could%20you%20give%20me%20direction%20about%20how%20to%20include%20these%20actions%20(remove%20table%20and%20plot%20values%26nbsp%3Bin%20the%20charts)%20using%20script%3F%26nbsp%3B%3C%2FP%3E%3CP%3EThanks%20again.%3C%2FP%3E%3CP%3E%26nbsp%3B%3C%2FP%3E%3CP%3E%26nbsp%3B%3C%2FP%3E%3CP%3E%3CSPAN%20class%3D%22lia-inline-image-display-wrapper%20lia-image-align-inline%22%20image-alt%3D%22chart.png%22%20style%3D%22width%3A%20999px%3B%22%3E%3CSPAN%20class%3D%22lia-inline-image-display-wrapper%22%20image-alt%3D%22chart.png%22%20style%3D%22width%3A%20999px%3B%22%3E%3Cspan%20class%3D%22lia-inline-image-display-wrapper%22%20image-alt%3D%22chart.png%22%20style%3D%22width%3A%20999px%3B%22%3E%3Cimg%20src%3D%22https%3A%2F%2Fcommunity.jmp.com%2Ft5%2Fimage%2Fserverpage%2Fimage-id%2F7695iECACAB6736373524%2Fimage-size%2Flarge%3Fv%3Dv2%26amp%3Bpx%3D999%22%20role%3D%22button%22%20title%3D%22chart.png%22%20alt%3D%22chart.png%22%20%2F%3E%3C%2Fspan%3E%3C%2FSPAN%3E%3C%2FSPAN%3E%3C%2FP%3E%3CP%3E%26nbsp%3B%3C%2FP%3E%3CP%3E%26nbsp%3B%3C%2FP%3E%3CP%3E%26nbsp%3B%3C%2FP%3E%3C%2FLINGO-BODY%3E%3CLINGO-SUB%20id%3D%22lingo-sub-44876%22%20slang%3D%22en-US%22%20mode%3D%22NONE%22%3ERe%3A%20Plotting%20lower%20%2F%20upper%20limits%20and%20average%20in%20a%20control%20chart%3C%2FLINGO-SUB%3E%3CLINGO-BODY%20id%3D%22lingo-body-44876%22%20slang%3D%22en-US%22%20mode%3D%22NONE%22%3E%3CP%3EThe%20values%20can%20be%20added%20to%20the%20chart.%20%26nbsp%3BIf%20there%20are%20not%20phases%2C%20the%20values%20are%20displayed%20as%20part%20of%20the%20chart%3C%2FP%3E%0A%3CP%3E%3CSPAN%20class%3D%22lia-inline-image-display-wrapper%20lia-image-align-inline%22%20image-alt%3D%22annotate2.PNG%22%20style%3D%22width%3A%20481px%3B%22%3E%3CSPAN%20class%3D%22lia-inline-image-display-wrapper%22%20image-alt%3D%22annotate2.PNG%22%20style%3D%22width%3A%20481px%3B%22%3E%3Cspan%20class%3D%22lia-inline-image-display-wrapper%22%20image-alt%3D%22annotate2.PNG%22%20style%3D%22width%3A%20481px%3B%22%3E%3Cimg%20src%3D%22https%3A%2F%2Fcommunity.jmp.com%2Ft5%2Fimage%2Fserverpage%2Fimage-id%2F7693i1A51A1E91F0149BF%2Fimage-size%2Flarge%3Fv%3Dv2%26amp%3Bpx%3D999%22%20role%3D%22button%22%20title%3D%22annotate2.PNG%22%20alt%3D%22annotate2.PNG%22%20%2F%3E%3C%2Fspan%3E%3C%2FSPAN%3E%3C%2FSPAN%3E%3C%2FP%3E%0A%3CP%3EBut%20if%20the%20data%20has%20phases%2C%20the%20values%2C%20as%20you%20are%20pointing%20out%20are%20in%20a%20table%20next%20to%20the%20chart%2C%20and%20you%20want%20them%20on%20the%20chart.%20%26nbsp%3BIf%20your%20old%20software%20allowed%20you%20to%20manually%20add%20the%20values%2C%20then%20you%20can%20do%20the%20same%20within%20JMP%20by%20just%20annotating%20the%20chart%3C%2FP%3E%0A%3CP%3E%3CSPAN%20class%3D%22lia-inline-image-display-wrapper%20lia-image-align-inline%22%20image-alt%3D%22annotate.PNG%22%20style%3D%22width%3A%20672px%3B%22%3E%3CSPAN%20class%3D%22lia-inline-image-display-wrapper%22%20image-alt%3D%22annotate.PNG%22%20style%3D%22width%3A%20672px%3B%22%3E%3Cspan%20class%3D%22lia-inline-image-display-wrapper%22%20image-alt%3D%22annotate.PNG%22%20style%3D%22width%3A%20672px%3B%22%3E%3Cimg%20src%3D%22https%3A%2F%2Fcommunity.jmp.com%2Ft5%2Fimage%2Fserverpage%2Fimage-id%2F7694i2B8E5319E5C70691%2Fimage-size%2Flarge%3Fv%3Dv2%26amp%3Bpx%3D999%22%20role%3D%22button%22%20title%3D%22annotate.PNG%22%20alt%3D%22annotate.PNG%22%20%2F%3E%3C%2Fspan%3E%3C%2FSPAN%3E%3C%2FSPAN%3E%3C%2FP%3E%0A%3CP%3EIf%20you%20need%20this%20programatically%20done%2C%20then%20a%20script%20could%20be%20used%20to%20simply%20read%20the%20values%20from%20the%20displayed%20table%20and%20placed%20onto%20the%20IR%20chart.%20%26nbsp%3B%3C%2FP%3E%0A%3CP%3EI%20noticed%20in%20your%20example%20from%20your%20old%20software%2C%20that%20only%20one%20set%20of%20limits%20were%20displayed%2C%20even%20though%20it%20appeared%20that%20there%20were%20different%20phases.%20%26nbsp%3BWas%20that%20because%20the%20limits%20were%20the%20same%20for%20all%20phases%3F%3C%2FP%3E%3C%2FLINGO-BODY%3E%3CLINGO-SUB%20id%3D%22lingo-sub-44873%22%20slang%3D%22en-US%22%20mode%3D%22NONE%22%3ERe%3A%20Plotting%20lower%20%2F%20upper%20limits%20and%20average%20in%20a%20control%20chart%3C%2FLINGO-SUB%3E%3CLINGO-BODY%20id%3D%22lingo-body-44873%22%20slang%3D%22en-US%22%20mode%3D%22NONE%22%3E%3CP%3EI'm%20the%20one%20who%20mis-understood.%20This%20topic%20has%20come%20up%20%3CA%20href%3D%22https%3A%2F%2Fcommunity.jmp.com%2Ft5%2FDiscussions%2FHow-do-I-add-labels-to-control-limits-and-mean-lines-on-a%2Ftd-p%2F19866%22%20target%3D%22_self%22%3Ebefore%3C%2FA%3E.%3C%2FP%3E%3C%2FLINGO-BODY%3E%3CLINGO-SUB%20id%3D%22lingo-sub-44872%22%20slang%3D%22en-US%22%20mode%3D%22NONE%22%3ERe%3A%20Plotting%20lower%20%2F%20upper%20limits%20and%20average%20in%20a%20control%20chart%3C%2FLINGO-SUB%3E%3CLINGO-BODY%20id%3D%22lingo-body-44872%22%20slang%3D%22en-US%22%20mode%3D%22NONE%22%3E%3CP%3E%26nbsp%3B%3C%2FP%3E%3CP%3E%26nbsp%3B%3C%2FP%3E%3CP%3E%26nbsp%3B%3C%2FP%3E%3CP%3EHi%2C%20thanks%20for%20quick%20answer.%3C%2FP%3E%3CP%3EI%20think%20I'm%20not%20so%20clear%20in%20my%20explanation.%20I%20need%20to%20plot%20the%20values%20for%20lower%2C%20upper%20and%20average%20lines.%3C%2FP%3E%3CP%3ESee%20below%20the%20example%20that%20I'm%20looking%20for.%20In%20the%20left%2C%20the%20software%20that%20I%20used%20in%20the%20past.%3C%2FP%3E%3CP%3EIf%20I%20can%20plot%20the%20values%20from%20Show%20Summaries%20Limits%20table%2C%20I%20can%20remove%20the%20table%20to%20report%20(the%20best%20layout%20to%20put%20in%20a%20presentation).%3C%2FP%3E%3CP%3E%26nbsp%3B%3C%2FP%3E%3CP%3E%3CSPAN%20class%3D%22lia-inline-image-display-wrapper%20lia-image-align-inline%22%20image-alt%3D%22charts.png%22%20style%3D%22width%3A%20999px%3B%22%3E%3CSPAN%20class%3D%22lia-inline-image-display-wrapper%22%20image-alt%3D%22charts.png%22%20style%3D%22width%3A%20999px%3B%22%3E%3Cspan%20class%3D%22lia-inline-image-display-wrapper%22%20image-alt%3D%22charts.png%22%20style%3D%22width%3A%20999px%3B%22%3E%3Cimg%20src%3D%22https%3A%2F%2Fcommunity.jmp.com%2Ft5%2Fimage%2Fserverpage%2Fimage-id%2F7692i7CA9D2FA9385335C%2Fimage-size%2Flarge%3Fv%3Dv2%26amp%3Bpx%3D999%22%20role%3D%22button%22%20title%3D%22charts.png%22%20alt%3D%22charts.png%22%20%2F%3E%3C%2Fspan%3E%3C%2FSPAN%3E%3C%2FSPAN%3E%3C%2FP%3E%3CP%3E%26nbsp%3B%3C%2FP%3E%3C%2FLINGO-BODY%3E%3CLINGO-SUB%20id%3D%22lingo-sub-44868%22%20slang%3D%22en-US%22%20mode%3D%22NONE%22%3ERe%3A%20Plotting%20lower%20%2F%20upper%20limits%20and%20average%20in%20a%20control%20chart%3C%2FLINGO-SUB%3E%3CLINGO-BODY%20id%3D%22lingo-body-44868%22%20slang%3D%22en-US%22%20mode%3D%22NONE%22%3E%3CP%3EYou%20could%20double-click%20on%20the%20vertical%20axis%20and%20add%20refernece%20lines%2C%20or%20add%20a%20custom%20graphics%20script%20to%20the%20graph%20box%20by%20right-clicking%20on%20this.%20For%20the%20second%20option%2C%20do%20'Help%20%26gt%3B%20Scripting%20Index'%20and%20search%20for%20'H%20Line'.%26nbsp%3B%3C%2FP%3E%3C%2FLINGO-BODY%3E
Choose Language Hide Translation Bar
vjalvim
Level I

Plotting lower / upper limits and average in a control chart

Hi guys,


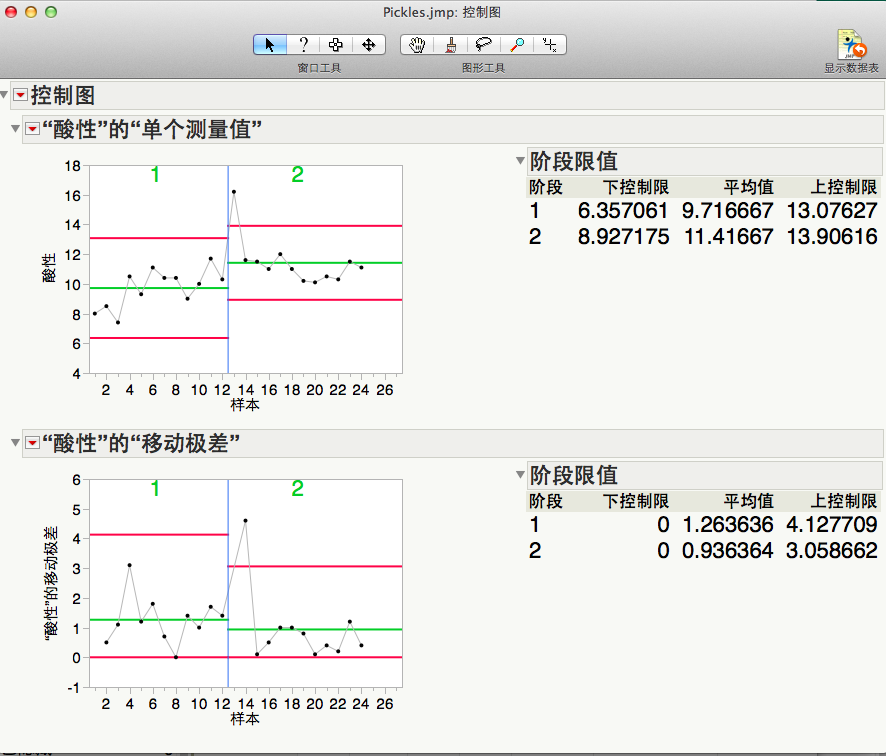
I would like to know if it is possible to plot the lower , upper and average values direct in the control chart (created by control chart builder) instead of Show Limit Summaries table.

Thanks.

15 REPLIES 15
txnelson
Super User

Re: Plotting lower / upper limits and average in a control chart

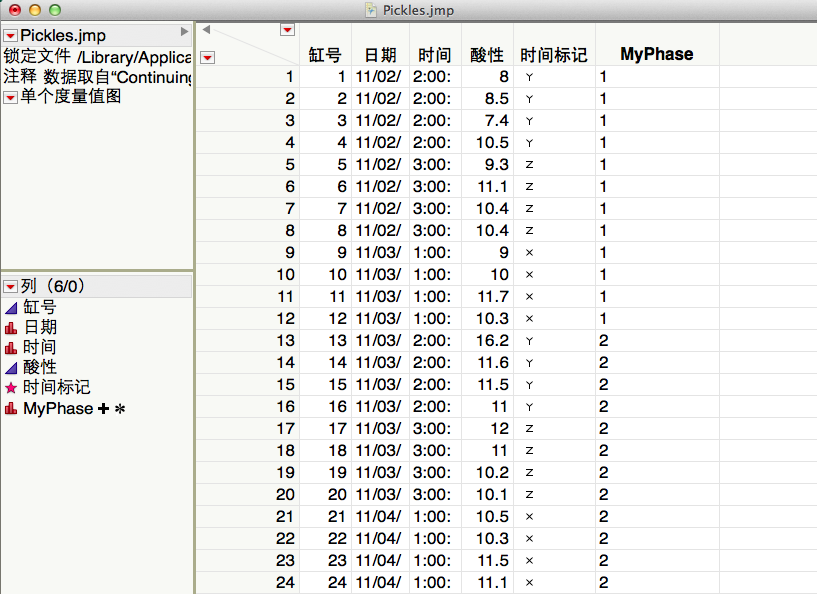
I have neither the access to JMP 11 or to a Mac, so I will need your help.  The message is pointing to a piece of code that is attemping to read the LCL from the displayed output table.  Can you please provide the image of the table that was generated by the control chart that has the limits in it?

Jim
GoodMan
Level III

Re: Plotting lower / upper limits and average in a control chart

The JSL is the same as you posted before. You can find the table image here. As you see that the text for LCL, UCL and Average have not been added.

Thanks.

txnelson
Super User

Re: Plotting lower / upper limits and average in a control chart

The script is looking for a specific Outline Box with the title, in English, of "Individual Measurement of Acid".  Your output is obviously not in English.  The below script changes the reference to Outline Box(2).  This is an absolute reference to the outline box, while "Individual Measurement of Acid" is a relative reference.  You could also try replacing "Individual Measurement of Acid" with

chinese.GIF

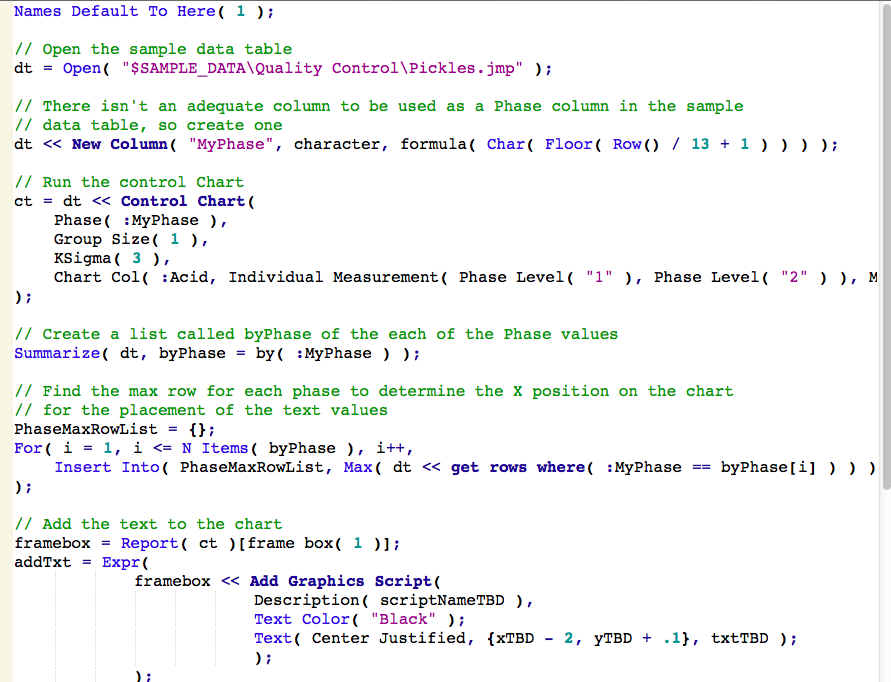
Names Default To Here( 1 );

// Open the sample data table
dt = Open( "$SAMPLE_DATA\Quality Control\Pickles.jmp" );

// There isn't an adequate column to be used as a Phase column in the sample
// data table, so create one
dt << New Column( "MyPhase", character, formula( Char( Floor( Row() / 13 + 1 ) ) ) );

// Run the control Chart
ct = dt << Control Chart(
	Phase( :MyPhase ),
	Group Size( 1 ),
	KSigma( 3 ),
	Chart Col( :Acid, Individual Measurement( Phase Level( "1" ), Phase Level( "2" ) ), Moving Range( Phase Level( "1" ), Phase Level( "2" ) ) )
);

// Create a list called byPhase of the each of the Phase values
Summarize( dt, byPhase = by( :MyPhase ) );

// Find the max row for each phase to determine the X position on the chart
// for the placement of the text values
PhaseMaxRowList = {};
For( i = 1, i <= N Items( byPhase ), i++,
	Insert Into( PhaseMaxRowList, Max( dt << get rows where( :MyPhase == byPhase[i] ) ) )
);

// Add the text to the chart
framebox = Report( ct )[frame box( 1 )];
addTxt = Expr(
			framebox << Add Graphics Script(
						Description( scriptNameTBD ),
						Text Color( "Black" );	
						Text( Center Justified, {xTBD - 2, yTBD + .1}, txtTBD );
						);
			);
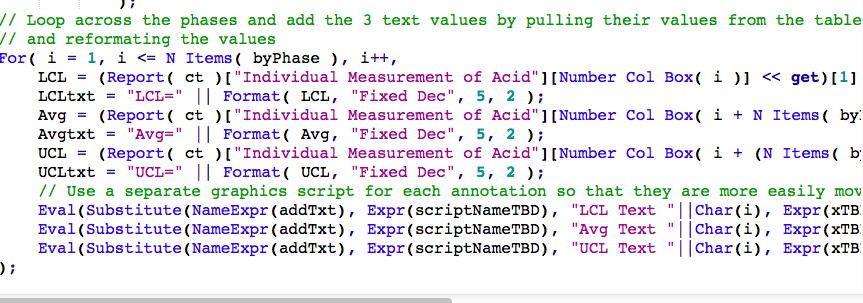
// Loop across the phases and add the 3 text values by pulling their values from the table
// and reformating the values
For( i = 1, i <= N Items( byPhase ), i++,
	LCL = (Report( ct )[Outline Box(2)][Number Col Box( i )] << get)[1];
	LCLtxt = "LCL=" || Format( LCL, "Fixed Dec", 5, 2 );
	Avg = (Report( ct )[Outline Box(2)][Number Col Box( i + N Items( byPhase ) )] << get)[1];
	Avgtxt = "Avg=" || Format( Avg, "Fixed Dec", 5, 2 );
	UCL = (Report( ct )[Outline Box(2)][Number Col Box( i + (N Items( byPhase ) * 2) )] << get)[1];
	UCLtxt = "UCL=" || Format( UCL, "Fixed Dec", 5, 2 );
	// Use a separate graphics script for each annotation so that they are more easily moved 'by hand'
	Eval(Substitute(NameExpr(addTxt), Expr(scriptNameTBD), "LCL Text "||Char(i), Expr(xTBD), PhaseMaxRowList[i], Expr(yTBD), LCL, Expr(txtTBD), LCLtxt));
	Eval(Substitute(NameExpr(addTxt), Expr(scriptNameTBD), "Avg Text "||Char(i), Expr(xTBD), PhaseMaxRowList[i], Expr(yTBD), Avg, Expr(txtTBD), Avgtxt));
	Eval(Substitute(NameExpr(addTxt), Expr(scriptNameTBD), "UCL Text "||Char(i), Expr(xTBD), PhaseMaxRowList[i], Expr(yTBD), UCL, Expr(txtTBD), UCLtxt));
);
Jim
GoodMan
Level III

Re: Plotting lower / upper limits and average in a control chart

Thank you. I checked in English pickle sample data still no success. I step to step to run the scrip and get the following report after i run Summarize( dt/*###*/, byPhase = by( :MyPhase ) ). I translate the log into English for you. Do you believe there is some wrong there?

必须是赋值运算符 正在访问或计算“dt”, dt/*###*/
Must use assignment operator in visiting "dt"
在以下脚本中,使用 /*###*/ 标记错误
in the following script, use /*###*/ to mark error
txnelson
Super User

Re: Plotting lower / upper limits and average in a control chart

The syntax of the "Summarize()" function has changed in the recent versions of JMP.  It seems that might be the issue.  Change the statement

     Summarize( dt, byPhase = by( :MyPhase ) );

to

     Summarize(  byPhase = by( :MyPhase ) );

Jim
GoodMan
Level III

Re: Plotting lower / upper limits and average in a control chart

Thank you,Jim. It works now!

Recommended Articles