- New to JMP? Join us Sept. 23-24 for the Early User Edition of Discovery Summit, tailor-made for new users. Register now for free!
- Your voice matters! Tell us how you prefer to receive JMP updates, so we can tailor our communication to your needs. Take short survey.
- See how to access JMP Marketplace - and - find, create & share add-ins to extend your JMP. Watch video.
- Subscribe to RSS Feed
- Mark Topic as New
- Mark Topic as Read
- Float this Topic for Current User
- Bookmark
- Subscribe
- Mute
- Printer Friendly Page
Discussions
Solve problems, and share tips and tricks with other JMP users.- JMP User Community
- :
- Discussions
- :
- Plot 2D Trace

- Mark as New
- Bookmark
- Subscribe
- Mute
- Subscribe to RSS Feed
- Get Direct Link
- Report Inappropriate Content
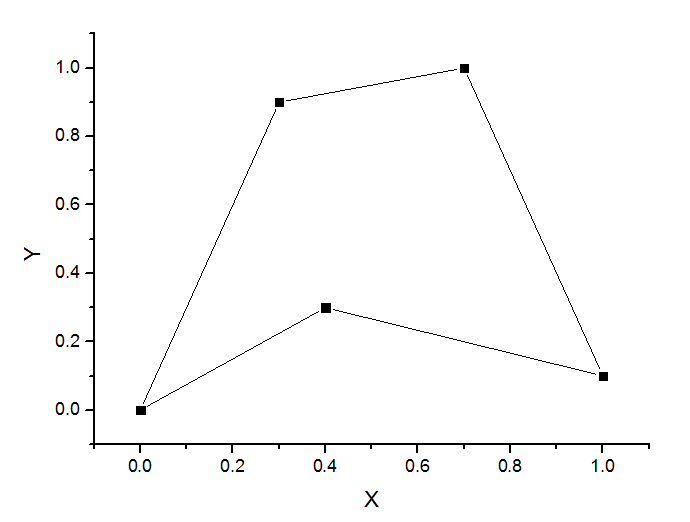
Plot 2D Trace
Is it possible to generate a 2D trace in JMP? I.e., plot a list of x/y coordinates, connecting consecutive points with a line, as shown in the attached PNG?

- Mark as New
- Bookmark
- Subscribe
- Mute
- Subscribe to RSS Feed
- Get Direct Link
- Report Inappropriate Content
Re: Plot 2D Trace
Something like:
NamesDefaultToHere(1);
n= 10;
x = J(n, 1, RandomInteger(0, 100));
y = J(n, 1, RandomInteger(0, 100));
NewWindow("XY Trace", GraphBox(PenColor("Red"), Line(x,y)));
Look in the JSL Guide or the Scripting Index for more details on the options for 'GraphBox()'. To get values from a column in a table into a matrix send the column a 'GetAsMatrix()' message.
- Mark as New
- Bookmark
- Subscribe
- Mute
- Subscribe to RSS Feed
- Get Direct Link
- Report Inappropriate Content
Re: Plot 2D Trace
Thanks lots!

- Mark as New
- Bookmark
- Subscribe
- Mute
- Subscribe to RSS Feed
- Get Direct Link
- Report Inappropriate Content
Re: Plot 2D Trace
I used the Bubble Plot platform...
//Create a table with the drawing points, repeat that origin (start and finish)
drawDT = New Table( "Draw Plot",
Add Rows( 6 ),
//Set the values for the coordinates to the table
New Column( "X", Numeric, "Continuous", Format( "Best", 12 ), Set Values( [0, 0.3, 0.7, 1, 0.4, 0] ) ),
New Column( "Y", Numeric, "Continuous", Format( "Best", 12 ), Set Values( [0, 0.9, 1, 0.1, 0.3, 0] ) ),
New Column( "Draw Order", Numeric, "Continuous", Format( "Best", 12 ), Set Values( [1, 2, 3, 4, 5, 6] ) )
);
//Create a new window with bubble plot
New Window( "Draw Plot",
//On close of the window, the data table is deleted
<<on close( Close( drawDT ) ),
Bubble Plot( X( :X ), Y( :Y ), Time( :Draw Order ), Time Index( 6 ), Trail Bubbles( "All" ), Trail Lines( "All" ), )
);

- Mark as New
- Bookmark
- Subscribe
- Mute
- Subscribe to RSS Feed
- Get Direct Link
- Report Inappropriate Content
Re: Plot 2D Trace
Thanks lots!

- Mark as New
- Bookmark
- Subscribe
- Mute
- Subscribe to RSS Feed
- Get Direct Link
- Report Inappropriate Content
Re: Plot 2D Trace
start with a data table

Open graph builder and drag the variables to the axes

turn off the points and smoother and turn on the line and select row order

click done and save the script (red triangle) if you want to run it again without all the drag-and-drop

Graph Builder(
  Show Control Panel( 0 ),
  Variables( X( :x ), Y( :y ) ),
  Elements(
  Line( X, Y, Legend( 3 ), Row order( 1 ), Summary Statistic( "Mean" ) )
  )
)
repeat the first point to close the loop if desired.

- Mark as New
- Bookmark
- Subscribe
- Mute
- Subscribe to RSS Feed
- Get Direct Link
- Report Inappropriate Content
Re: Plot 2D Trace
Thanks lots!
Recommended Articles
- © 2026 JMP Statistical Discovery LLC. All Rights Reserved.
- Terms of Use
- Privacy Statement
- Contact Us