- New to JMP? Join us Sept. 23-24 for the Early User Edition of Discovery Summit, tailor-made for new users. Register now for free!
- Subscribe to RSS Feed
- Mark Topic as New
- Mark Topic as Read
- Float this Topic for Current User
- Bookmark
- Subscribe
- Mute
- Printer Friendly Page
Discussions
Solve problems, and share tips and tricks with other JMP users.- JMP User Community
- :
- Discussions
- :
- Re: Per row graph

- Mark as New
- Bookmark
- Subscribe
- Mute
- Subscribe to RSS Feed
- Get Direct Link
- Report Inappropriate Content
Per row graph
Hello,
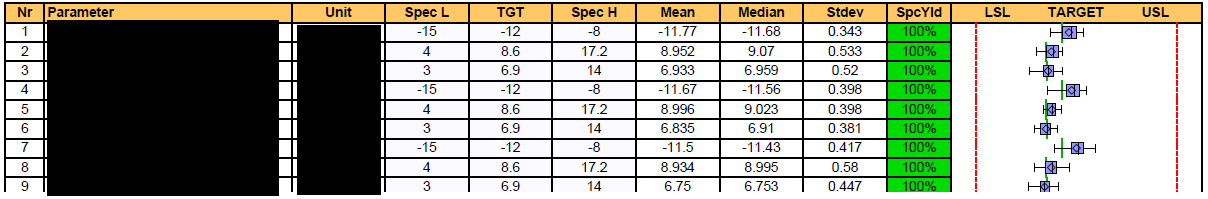
I would like to replicate the following graph using JMP. particularly the rightmost column. (the graph column - not SpcYld)
I've looked through the various platforms, and i feel like i must be missing something.
Thank you very much
Accepted Solutions

- Mark as New
- Bookmark
- Subscribe
- Mute
- Subscribe to RSS Feed
- Get Direct Link
- Report Inappropriate Content
Re: Per row graph
The Process Capability platform provides most of what you want. Within the current capability, it provides all of what you want except the Units and Median values

By default, the top table provides many more values, but I right clicked on the table, and removed all of the columns that were not specified in your example.
Some fairly simple scripting could add in the Units and Median columns.
- Mark as New
- Bookmark
- Subscribe
- Mute
- Subscribe to RSS Feed
- Get Direct Link
- Report Inappropriate Content
Re: Per row graph
The Process Capability platform provides most of what you want. Within the current capability, it provides all of what you want except the Units and Median values
By default, the top table provides many more values, but I right clicked on the table, and removed all of the columns that were not specified in your example.
Some fairly simple scripting could add in the Units and Median columns.
Recommended Articles
- © 2026 JMP Statistical Discovery LLC. All Rights Reserved.
- Terms of Use
- Privacy Statement
- Contact Us