- Learn how to build custom Python data connectors and further customize JMP’s Data Connector Framework with the Python Data Connector Demo, available now in the JMP Marketplace!
- See how to move from signal modeling to system modeling at the first JMP Aerospace Analytics webinar. Register. June 18, 1 p.m. US Eastern Time.
- Subscribe to RSS Feed
- Mark Topic as New
- Mark Topic as Read
- Float this Topic for Current User
- Bookmark
- Subscribe
- Mute
- Printer Friendly Page
Discussions
Solve problems, and share tips and tricks with other JMP users.- JMP User Community
- :
- Discussions
- :
- Overlaying points on graph generated with Y Function()

- Mark as New
- Bookmark
- Subscribe
- Mute
- Subscribe to RSS Feed
- Get Direct Link
- Report Inappropriate Content
Overlaying points on graph generated with Y Function()
Hi all,
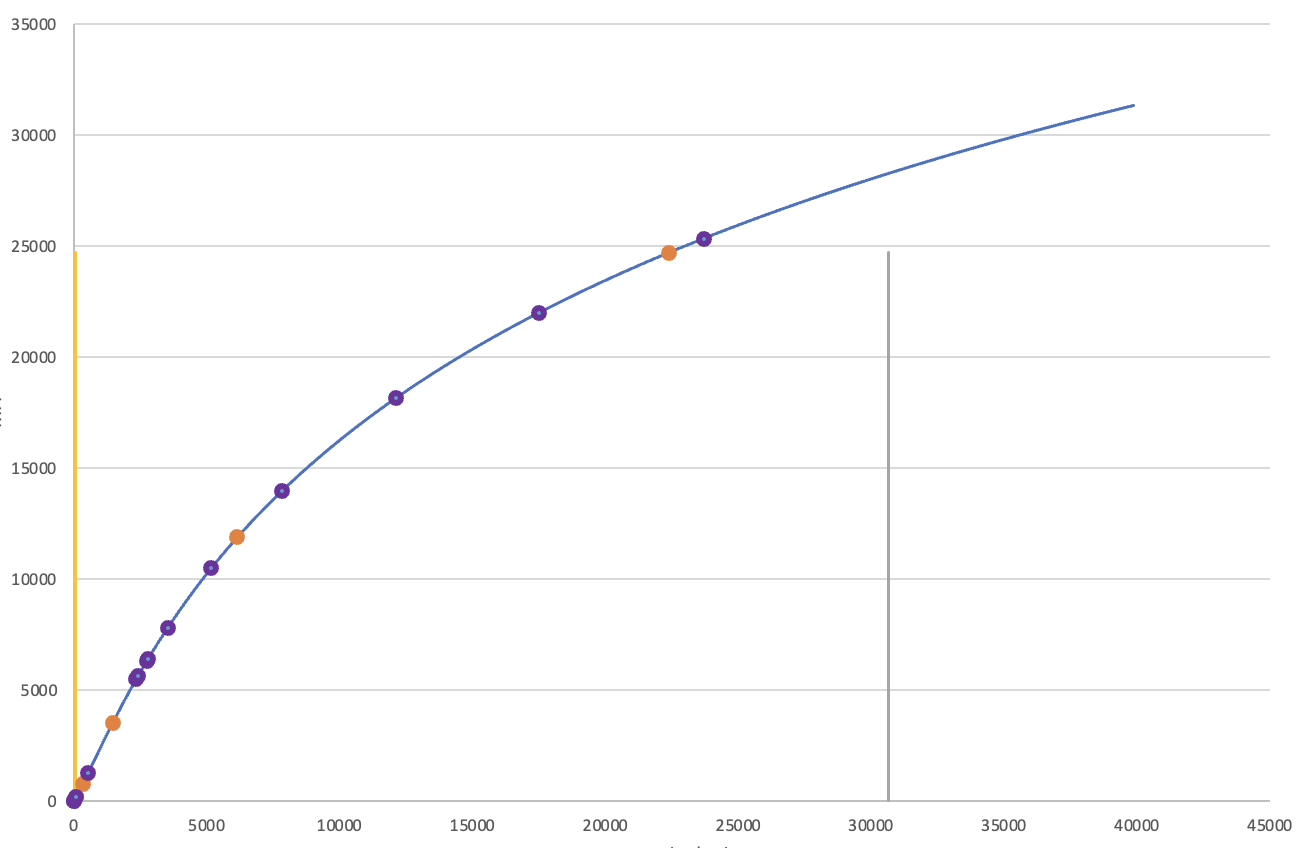
I'm using Y Function () to visualize function, but I'd also like to overlay individual points on the graph. These points will reside on the function line. If that makes sense. Attached example in excel that I'd like to recreate in JMP.
-Matt
Accepted Solutions

- Mark as New
- Bookmark
- Subscribe
- Mute
- Subscribe to RSS Feed
- Get Direct Link
- Report Inappropriate Content
Re: Overlaying points on graph generated with Y Function()

- Mark as New
- Bookmark
- Subscribe
- Mute
- Subscribe to RSS Feed
- Get Direct Link
- Report Inappropriate Content
Re: Overlaying points on graph generated with Y Function()
If you are drawing your graph from scratch, using a Graph Box() and then using the Y function() for drawing your curve, you can simply add to your code and use the Marker() function to draw your points at the X,Y locations you want.
Another way to accomplish this would be to us the Graph Builder Platform to draw your scatterplot values, and then just add the Y Function() as a graphical addition( << add graphics script) to the Graph Builder output.
- Mark as New
- Bookmark
- Subscribe
- Mute
- Subscribe to RSS Feed
- Get Direct Link
- Report Inappropriate Content
Re: Overlaying points on graph generated with Y Function()

- Mark as New
- Bookmark
- Subscribe
- Mute
- Subscribe to RSS Feed
- Get Direct Link
- Report Inappropriate Content
Re: Overlaying points on graph generated with Y Function()
If you are drawing your graph from scratch, using a Graph Box() and then using the Y function() for drawing your curve, you can simply add to your code and use the Marker() function to draw your points at the X,Y locations you want.
Another way to accomplish this would be to us the Graph Builder Platform to draw your scatterplot values, and then just add the Y Function() as a graphical addition( << add graphics script) to the Graph Builder output.
- Mark as New
- Bookmark
- Subscribe
- Mute
- Subscribe to RSS Feed
- Get Direct Link
- Report Inappropriate Content
Re: Overlaying points on graph generated with Y Function()
@txnelson answer about Graph Builder is correct if you are using a data table. You can use a data table from within the graph box example, but it won't get all the graph builder features (scaling the axes, legends, fitted lines, ease-of-use.) Interactively, with graph builder, right-click->Customize->BigPlus to add a graphic script, then save the script when done from the graph builder red triangle.
Recommended Articles
- © 2026 JMP Statistical Discovery LLC. All Rights Reserved.
- Terms of Use
- Privacy Statement
- Contact Us