- Don’t miss your chance to experience Discovery Summit Europe at our best available rate! Early bird registration through 31 Oct.
- Graph Builder Toolbar streamlines interactive graphing. Creates shortcuts on Report and GraphBuilder Helpers toolbars. Download and install the extension.
- Subscribe to RSS Feed
- Mark Topic as New
- Mark Topic as Read
- Float this Topic for Current User
- Bookmark
- Subscribe
- Mute
- Printer Friendly Page
Discussions
Solve problems, and share tips and tricks with other JMP users.- User Community
- :
- Discussions
- :
- Re: Overlapping Boxplots

- Mark as New
- Bookmark
- Subscribe
- Mute
- Subscribe to RSS Feed
- Get Direct Link
- Report Inappropriate Content
Overlapping Boxplots
Hello JMP-Community,
since 3 weeks I am using JMP now and I am still trying to plot some data against a continuosly diffentiable y-axis, in form of boxplots. As far there is enough space between the single data points the programm shows me nice boxes. In case of the data points are too close, just lines are shown. Somehow, is it possible to broaden the boxes so they are overlapping without using categories for my y-axis?
In German - falls ich mein Problem so besser erläutern kann.
Ich nutze JMP erst seit 3 Wochen und möchte, dass JMP mir Boxplots ausspuckt, die sich durchaus auch überschneiden. Mein Problem bisher: Liegen die Datenpunkte weit genug auseinander kommt es zu keiner Überschneidung, folglich werden mir wunderbare Boxen angezeigt. In manchen Fällen liegen die Datenpunkte aber sehr eng zusammen und dann werden mir die Boxplots als Striche angezeigt. Kann ich das Problem irgendwie umgehen? Ich möchte keine Kategorien auf der Y-Achse einrichten müssen.
I am looking forward for your suggestions/solutions! Ich bin mal auf eure Ratschläge gespannt!
Beste Grüße, Ska


- Mark as New
- Bookmark
- Subscribe
- Mute
- Subscribe to RSS Feed
- Get Direct Link
- Report Inappropriate Content
Re: Overlapping Boxplots
(I will answer in German to start the conversaton, in case we work on the solution, I will post in later in English)
Hallo Ska,
ich bin unter anderem für den deutschsprachigen Raum zuständig und versuche mal hier zu helfen. Ich habe eine gewisse visuelle Vorstellung was gewünscht ist, bin mir aber noch nicht über die verwendeten Daten im klaren. Können wir uns dazu offline unterhalten und dann das Ergebnis hier wieder posten (gerne zweisprachig).
Meine Kontaktdaten sind am einfachsten:
da ich heute noch Termine habe. Morgen können wir telefonieren. Wenn möglich, bitte mir ein Beispieldatensatz mitschicken. Falls das nicht geht, können wir auch ein Webex durchführen und ich schau mir das ganze aus der Ferne an.
Viele Grüße,
Martin
- Mark as New
- Bookmark
- Subscribe
- Mute
- Subscribe to RSS Feed
- Get Direct Link
- Report Inappropriate Content
Re: Overlapping Boxplots
Hi,
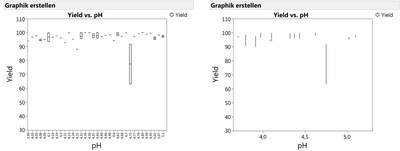
we have talked to each other and the effect was due to having set the x-variable as a continuous one, and this continuous one had many different values spread over a wide range. Taking it nominal had the well known wider appearance, although (as you can see below) the more levels you have the thinner the boxes get. Using the box plots in the Graph Builder might be valuable, but in case you want to get also statistical analysis involved you should look for other analysis like Fit Y by X (ANOVA, Bivariate, ...), or Distribution. Especially in case you want to understand what's driving your response to increase GB is a good tool to start, looking further into Distribution, Fit Y by X as well other kind of one or two factor at a time approaches. Ending up with a Fit Model taking into account also other effects than just the main effects. With the profiler you then can optimize, simulate and play around for different factor settings to find other conclusions.Too make it more concrete here two screenshots. Left with PH as nominal (can see the box), right as continuous(just a line):
Best, Martin

- Mark as New
- Bookmark
- Subscribe
- Mute
- Subscribe to RSS Feed
- Get Direct Link
- Report Inappropriate Content
Re: Overlapping Boxplots
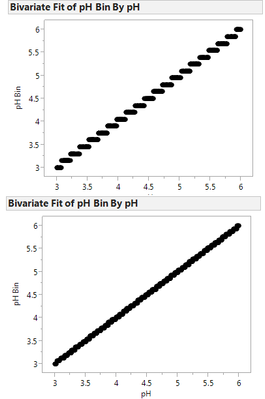
You could try to "bin" your pH values so that you have fewer boxes in the box plot, but still use a continuous x for the display. Create a new column with the following formula (assuming your x axis is in the column "pH"). Change the number to define your number of "bins" (in the case: 20), which will change the number of box plots and, in effect, their width..
Col Minimum( :pH ) + Round(
(:pH - Col Minimum( :pH )) / ((Col Maximum( :pH ) - Col Minimum( :pH )) / 20),
0
) * ((Col Maximum( :pH ) - Col Minimum( :pH )) / 20)
For the quantitative analysis, use the proper pH, instead of the binned pH. Binning is just for displaying.
Plot of pH vs binned pH, with 20 bins and 50 bins.
- Mark as New
- Bookmark
- Subscribe
- Mute
- Subscribe to RSS Feed
- Get Direct Link
- Report Inappropriate Content
Re: Overlapping Boxplots
Hi jvillaumie,
thanks for this suggestion, this could be a welcome workaround for ska01 regarding displaying the data.
Martin
Recommended Articles
- © 2026 JMP Statistical Discovery LLC. All Rights Reserved.
- Terms of Use
- Privacy Statement
- Contact Us