- New to JMP? Join us Sept. 23-24 for the Early User Edition of Discovery Summit, tailor-made for new users. Register now for free!
- Use World Cup data to build models, explore spatial relationships, and create informative visualizations in JMP. Register. July 17, 2 pm US Eastern Time.
- Your voice matters! Tell us how you prefer to receive JMP updates, so we can tailor our communication to your needs. Take short survey.
- Subscribe to RSS Feed
- Mark Topic as New
- Mark Topic as Read
- Float this Topic for Current User
- Bookmark
- Subscribe
- Mute
- Printer Friendly Page
Discussions
Solve problems, and share tips and tricks with other JMP users.- JMP User Community
- :
- Discussions
- :
- Re: Output JMP table to formatted journal or picture with wrapped cells

- Mark as New
- Bookmark
- Subscribe
- Mute
- Subscribe to RSS Feed
- Get Direct Link
- Report Inappropriate Content
Output JMP table to formatted journal or picture with wrapped cells
Hello!
Looking for help.
I am a new JMP user having a hard time with a seemingly simple task.
I have a 2x3 table.
Column 1 is short text (date)...
Column 2 is text, very long text.
I need to get the table to an exported format, either journal or picture file.
CRITICALLY important is that I am able to define the table size and wrap the text from column 2.
Please help.
TIA
Accepted Solutions

- Mark as New
- Bookmark
- Subscribe
- Mute
- Subscribe to RSS Feed
- Get Direct Link
- Report Inappropriate Content
Re: Output JMP table to formatted journal or picture with wrapped cells
Below is a start at answering your question. Not knowing what you mean by "very long text" I had to just grab a bunch of text for my example. Take a look, and see the if some refining this may solve your issue.
names default to here(1);
dt = New Table( "Example",
	Add Rows( 3 ),
	Set Cell Height( 178 ),
	New Column( "date",
		Numeric,
		"Continuous",
		Format( "m/d/y", 10 ),
		Input Format( "m/d/y" ),
		Set Values( [3662582400, 3664396800, 3667075200] )
	),
	New Column( "Text",
		Character,
		"Nominal",
		Set Values(
			{
			"This book describes the initial types of analyses that you often perform in JMP:
• The Distribution platform illustrates the distribution of a single variable using histograms, additional graphs, and reports. Once you know how your data is distributed, you can plan the appropriate type of analysis going forward. See Distributions.
• The Fit Y by X platform analyzes the pair of X and Y variables that you specify, by context, based on modeling type. See Introduction to Fit Y by X. The four types of analyses include:
– The Bivariate platform, which analyzes the relationship between two continuous X variables. See Bivariate Analysis.
– The Oneway platform, which analyzes how the distribution of a continuous Y variable differs across groups defined by a categorical X variable. See Chapter 6, “Oneway Analysis”.
– The Contingency platform, which analyzes the distribution of a categorical response variable Y as conditioned by the values of a categorical X factor. See Contingency Analysis.
– The Logistic platform, which fits the probabilities for response categories (Y) to a continuous X predictor. See Logistic Analysis.
• The Tabulate platform interactively constructs tables of descriptive statistics. See Tabulate.
• The Simulate feature provides parametric and nonparametric simulation capability. See Simulate.
• Bootstrap analysis approximates the sampling distribution of a statistic. The data is re-sampled with replacement and the statistic is computed. This process is repeated to produce a distribution of values for the statistic. See Bootstrapping.
• The Text Explorer platform enables you to categorize and analyze unformatted text data. You can use regular expressions to clean up the data before you proceed to analysis. See Text Explorer.",
			"The Distribution platform illustrates the distribution of a single variable using histograms, additional graphs, and reports. The word univariate simply means involving one variable instead of two (bivariate) or many (multivariate). However, you can examine the distribution of several individual variables within a report. The report content for each variable changes depending on whether the variable is categorical (nominal or ordinal) or continuous.",
			"The Bivariate platform shows the relationship between two continuous variables. It is the continuous by continuous personality of the Fit Y by X platform. The word bivariate simply means involving two variables instead of one (univariate) or many (multivariate).
The Bivariate analysis results appear in a scatterplot. Each point on the plot represents the X and Y values for a single observation; in other words, each point represents two variables. Using the scatterplot, you can see at a glance the degree and pattern of the relationship between the two variables. You can interactively add other types of fits, such as simple linear regression, polynomial regression, and so on."
			}
		)
	)
);
 dt<< set window size(1500,800);

dt:text << set Display Width(1200);
nw=new window("test",<<journal);

nw<<append(window("Example")<<get picture);- Mark as New
- Bookmark
- Subscribe
- Mute
- Subscribe to RSS Feed
- Get Direct Link
- Report Inappropriate Content
Re: Output JMP table to formatted journal or picture with wrapped cells
- Mark as New
- Bookmark
- Subscribe
- Mute
- Subscribe to RSS Feed
- Get Direct Link
- Report Inappropriate Content
Re: Output JMP table to formatted journal or picture with wrapped cells
If you run the following after creating the Example data table I sent
 dt<< set window size(1500,800);

dt:text << set Display Width(1200);
nw=new window("test",<<journal);
dt << close side panels(1);
nw<<append(window("Example")<<get picture);

nw << save presentation("$TEMP/text2.pptx");

open("$TEMP/text2.pptx");
You will get a PowerPoint slide that looks like this

This is pretty close to the best you can get using this approach. You could take the time to create your own Display Window, using alternative display objects that should get you exactly what you want.
- Mark as New
- Bookmark
- Subscribe
- Mute
- Subscribe to RSS Feed
- Get Direct Link
- Report Inappropriate Content
Re: Output JMP table to formatted journal or picture with wrapped cells
Below is a start at answering your question. Not knowing what you mean by "very long text" I had to just grab a bunch of text for my example. Take a look, and see the if some refining this may solve your issue.
names default to here(1);
dt = New Table( "Example",
	Add Rows( 3 ),
	Set Cell Height( 178 ),
	New Column( "date",
		Numeric,
		"Continuous",
		Format( "m/d/y", 10 ),
		Input Format( "m/d/y" ),
		Set Values( [3662582400, 3664396800, 3667075200] )
	),
	New Column( "Text",
		Character,
		"Nominal",
		Set Values(
			{
			"This book describes the initial types of analyses that you often perform in JMP:
• The Distribution platform illustrates the distribution of a single variable using histograms, additional graphs, and reports. Once you know how your data is distributed, you can plan the appropriate type of analysis going forward. See Distributions.
• The Fit Y by X platform analyzes the pair of X and Y variables that you specify, by context, based on modeling type. See Introduction to Fit Y by X. The four types of analyses include:
– The Bivariate platform, which analyzes the relationship between two continuous X variables. See Bivariate Analysis.
– The Oneway platform, which analyzes how the distribution of a continuous Y variable differs across groups defined by a categorical X variable. See Chapter 6, “Oneway Analysis”.
– The Contingency platform, which analyzes the distribution of a categorical response variable Y as conditioned by the values of a categorical X factor. See Contingency Analysis.
– The Logistic platform, which fits the probabilities for response categories (Y) to a continuous X predictor. See Logistic Analysis.
• The Tabulate platform interactively constructs tables of descriptive statistics. See Tabulate.
• The Simulate feature provides parametric and nonparametric simulation capability. See Simulate.
• Bootstrap analysis approximates the sampling distribution of a statistic. The data is re-sampled with replacement and the statistic is computed. This process is repeated to produce a distribution of values for the statistic. See Bootstrapping.
• The Text Explorer platform enables you to categorize and analyze unformatted text data. You can use regular expressions to clean up the data before you proceed to analysis. See Text Explorer.",
			"The Distribution platform illustrates the distribution of a single variable using histograms, additional graphs, and reports. The word univariate simply means involving one variable instead of two (bivariate) or many (multivariate). However, you can examine the distribution of several individual variables within a report. The report content for each variable changes depending on whether the variable is categorical (nominal or ordinal) or continuous.",
			"The Bivariate platform shows the relationship between two continuous variables. It is the continuous by continuous personality of the Fit Y by X platform. The word bivariate simply means involving two variables instead of one (univariate) or many (multivariate).
The Bivariate analysis results appear in a scatterplot. Each point on the plot represents the X and Y values for a single observation; in other words, each point represents two variables. Using the scatterplot, you can see at a glance the degree and pattern of the relationship between the two variables. You can interactively add other types of fits, such as simple linear regression, polynomial regression, and so on."
			}
		)
	)
);
 dt<< set window size(1500,800);

dt:text << set Display Width(1200);
nw=new window("test",<<journal);

nw<<append(window("Example")<<get picture);- Mark as New
- Bookmark
- Subscribe
- Mute
- Subscribe to RSS Feed
- Get Direct Link
- Report Inappropriate Content
Re: Output JMP table to formatted journal or picture with wrapped cells

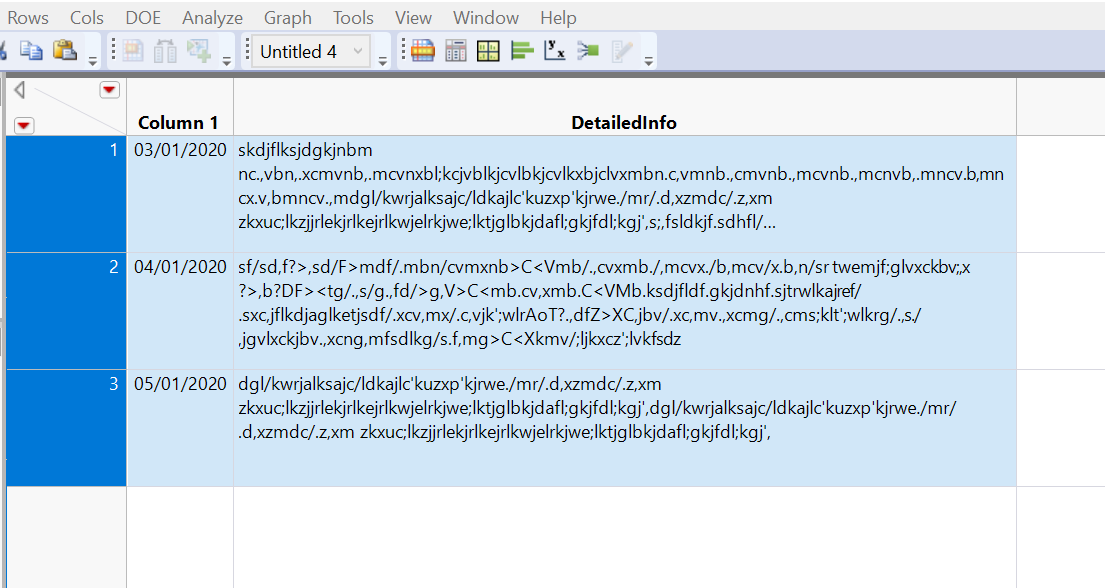
This is the type of table. By long data, I just mean a lot of characters :)
If I dump it to a journal, it doesn't keep the column or row specifications from the table and it does not wrap the text.
I need the output to look like this, but in photo or some other format I can transport to non-jmp users.
thanks so much!
- Mark as New
- Bookmark
- Subscribe
- Mute
- Subscribe to RSS Feed
- Get Direct Link
- Report Inappropriate Content
Re: Output JMP table to formatted journal or picture with wrapped cells
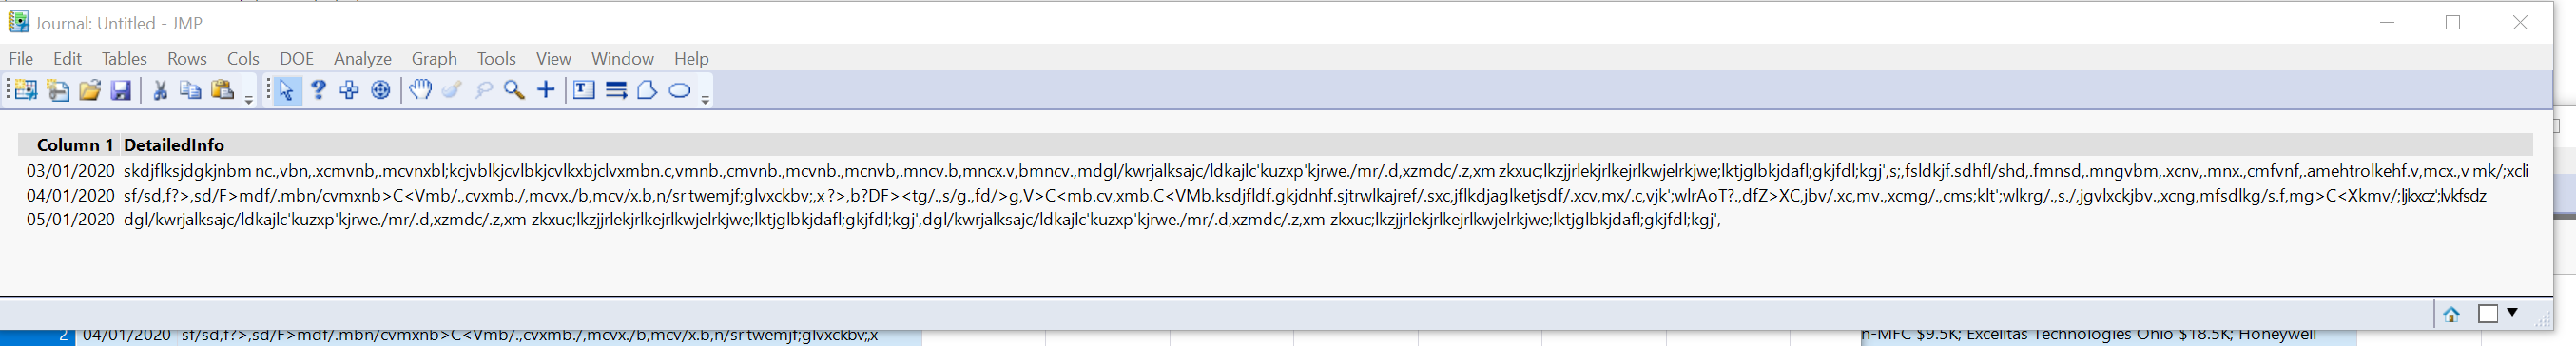
This is what it looks like when I dump to a journal:

I need the columns and rows to look like the data table view.
Also, need the text in DETAILS column to be wrapped, accordingly.
thanks again
- Mark as New
- Bookmark
- Subscribe
- Mute
- Subscribe to RSS Feed
- Get Direct Link
- Report Inappropriate Content
Re: Output JMP table to formatted journal or picture with wrapped cells
That works - question for you - is there any way to get rid of the left bar where it has the example, columns, rows? So you just see the data?
- Mark as New
- Bookmark
- Subscribe
- Mute
- Subscribe to RSS Feed
- Get Direct Link
- Report Inappropriate Content
Re: Output JMP table to formatted journal or picture with wrapped cells
Also, I need just the data in the table, not the whole picture.
Would like it without the extra columns and the left menu items.
Please advise.
Thank you so much for your help!
- Mark as New
- Bookmark
- Subscribe
- Mute
- Subscribe to RSS Feed
- Get Direct Link
- Report Inappropriate Content
Re: Output JMP table to formatted journal or picture with wrapped cells
If you run the following after creating the Example data table I sent
 dt<< set window size(1500,800);

dt:text << set Display Width(1200);
nw=new window("test",<<journal);
dt << close side panels(1);
nw<<append(window("Example")<<get picture);

nw << save presentation("$TEMP/text2.pptx");

open("$TEMP/text2.pptx");
You will get a PowerPoint slide that looks like this
This is pretty close to the best you can get using this approach. You could take the time to create your own Display Window, using alternative display objects that should get you exactly what you want.
- Mark as New
- Bookmark
- Subscribe
- Mute
- Subscribe to RSS Feed
- Get Direct Link
- Report Inappropriate Content
Re: Output JMP table to formatted journal or picture with wrapped cells
dt << close side panels(1)will close the side panels.
Recommended Articles
- © 2026 JMP Statistical Discovery LLC. All Rights Reserved.
- Terms of Use
- Privacy Statement
- Contact Us