- Subscribe to RSS Feed
- Mark Topic as New
- Mark Topic as Read
- Float this Topic for Current User
- Bookmark
- Subscribe
- Mute
- Printer Friendly Page
Discussions
Solve problems, and share tips and tricks with other JMP users.- JMP User Community
- :
- Discussions
- :
- Re: Orthogonal regression intercept CI
- Mark as New
- Bookmark
- Subscribe
- Mute
- Subscribe to RSS Feed
- Get Direct Link
- Report Inappropriate Content
Orthogonal regression intercept CI
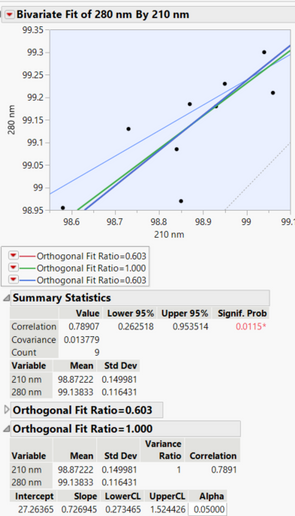
I need support in interpretation results of 2 methods bridging (210 vs 280).
The results of Bland Altman plot and orthogonal fit are below.
- How to calculate in JMP CI for intercept in this case?
- I need to know if 27.2 is significant. It should not be... Results differ with mean difference around 0.27.
- Mark as New
- Bookmark
- Subscribe
- Mute
- Subscribe to RSS Feed
- Get Direct Link
- Report Inappropriate Content
Re: Orthogonal regression intercept CI
This is more challenging than you might think. To see why, save the predicted values from your Orthogonal fit. You will see two prediction columns and both have formulas that are very different than what is in the report. This is due to the uncertainty in both the X and the Y.
There has to be a better way to get what you want than what I am about to show, but I can't think of it right now. So, an approach:
Use nonlinear estimation. Create a column with a formula that has the linear model with the intercept (with initial value CLOSE to the 27 you saw in the report) as the only parameter and hard code in the slope to as many digits as possible. Use Analyze > Specialized Modeling > Nonlinear specifying this new column as the X and your Y variable as the Y. Click Go. You should see the intercept converge to what was in the Fit Orthogonal report. Click the Confidence Limits button and the confidence interval for the intercept will be shown in the parameter table.
- Mark as New
- Bookmark
- Subscribe
- Mute
- Subscribe to RSS Feed
- Get Direct Link
- Report Inappropriate Content
Re: Orthogonal regression intercept CI
Should it be a column in the primary dataset?
I have a structure like:
So that, the new column "Monomer model" will have values for all observations (for method A and method B)?
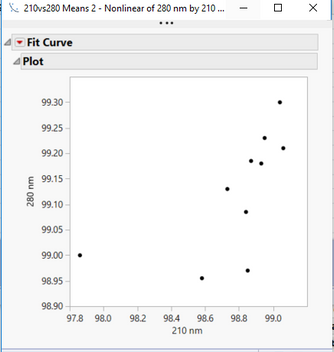
After the modeling I have just a plot:
Could you guide be a bit, please?
- Mark as New
- Bookmark
- Subscribe
- Mute
- Subscribe to RSS Feed
- Get Direct Link
- Report Inappropriate Content
Re: Orthogonal regression intercept CI
Go back to the data table that had your Orthogonal Fit. You had a column for 210 and a column for 280. You had 210 on the X-axis and 280 on the Y-axis.
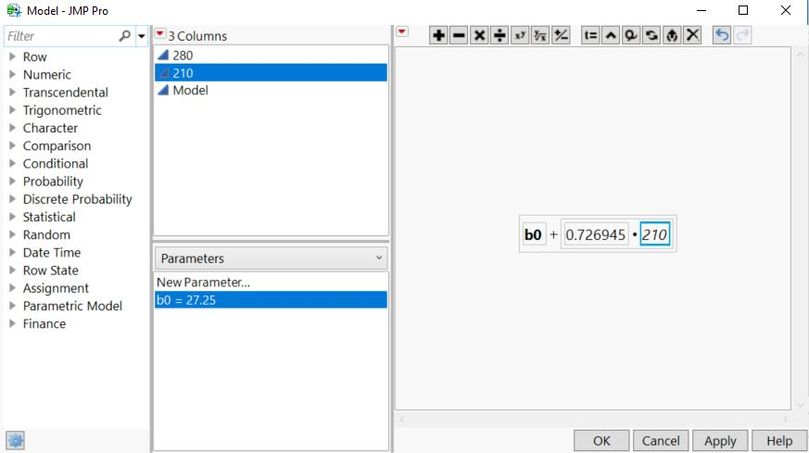
Create a new column, let's call it Model. The equation will look like this:
Note the parameter, b0, in the bottom center and the initial value that is close to the intercept from your Orthogonal Fit. Note the formula that uses the parameter of b0 and the hard-coded slope from the Orthogonal Fit multiplying the 210 column.
Now go to the nonlinear fit platform. This Model column is the X, Predictor Formula. The 280 column will be the Y, Response column. Click OK. In the Nonlinear Control Panel, click Go. When it stops, the b0 parameter should match the Fit Orthogonal Results. Then click on Confidence Limits button to see the confidence interval.
Remember that your interpretation of the intercept is NOT the same as for a regression model. I would NOT expect this to be 0 even if 280 and 210 are measuring the same thing, just like I would not expect the slope to be 1. This is because the Fit Orthogonal is utilizing the variability in both the X and the Y. So be extremely careful on how you interpret the confidence interval.
- Mark as New
- Bookmark
- Subscribe
- Mute
- Subscribe to RSS Feed
- Get Direct Link
- Report Inappropriate Content
Re: Orthogonal regression intercept CI
If you advice to be careful in interpretation, what would you suggest to do to compare the methods?
The mean difference is almost 0, we such a huge intercept? With a pretty small CI = [27.2, 27.3]
- Mark as New
- Bookmark
- Subscribe
- Mute
- Subscribe to RSS Feed
- Get Direct Link
- Report Inappropriate Content
Re: Orthogonal regression intercept CI
Honestly, I don't know how I would interpret the intercept for this. In regression, the error is the vertical distance from data points to the regression line. For Orthogonal regression it is the perpendicular distance from a point to the line. Add to that your data is in the 98 to 100 range, I'm not sure what value the intercept actually provides in this case. Perhaps someone else could chime in if they have an interpretation.
- Mark as New
- Bookmark
- Subscribe
- Mute
- Subscribe to RSS Feed
- Get Direct Link
- Report Inappropriate Content
Re: Orthogonal regression intercept CI
In doing a bit more research on this, although I gave an approach for the confidence interval of the intercept, I am not sure it is the correct value for this application. Most of the work that I am seeing claims that you need to use a jacknife approach to estimate the appropriate standard error. The nonlinear approach that I suggested is not doing that. So now be even MORE careful of the interpretation.
- Mark as New
- Bookmark
- Subscribe
- Mute
- Subscribe to RSS Feed
- Get Direct Link
- Report Inappropriate Content
Re: Orthogonal regression intercept CI
Do you have any idea what the method to estimate CI in JMP is?
Can it be changed?
- Mark as New
- Bookmark
- Subscribe
- Mute
- Subscribe to RSS Feed
- Get Direct Link
- Report Inappropriate Content
Re: Orthogonal regression intercept CI
I don't know the approach used for calculating the confidence interval for the slope. I know that it cannot be changed. You could write a JMP script to calculate the confidence intervals that you need.
Finally, the approach that I originally outlined would certainly be flawed. With orthogonal regression the ratio of the error variances is used to estimate the relationship. The nonlinear approach is not taking that error variance into account. I am certain that the nonlinear approach would lead to a tighter confidence interval.
If you have JMP Pro, you could use bootstrapping to estimate the confidence intervals, rather than calculating them.
Recommended Articles
- © 2026 JMP Statistical Discovery LLC. All Rights Reserved.
- Terms of Use
- Privacy Statement
- Contact Us


