- New to JMP? Join us Sept. 23-24 for the Early User Edition of Discovery Summit, tailor-made for new users. Register now for free!
- Your voice matters! Tell us how you prefer to receive JMP updates, so we can tailor our communication to your needs. Take short survey.
- See how to access JMP Marketplace - and - find, create & share add-ins to extend your JMP. Watch video.
- Subscribe to RSS Feed
- Mark Topic as New
- Mark Topic as Read
- Float this Topic for Current User
- Bookmark
- Subscribe
- Mute
- Printer Friendly Page
Discussions
Solve problems, and share tips and tricks with other JMP users.- JMP User Community
- :
- Discussions
- :
- Normality and Capability

- Mark as New
- Bookmark
- Subscribe
- Mute
- Subscribe to RSS Feed
- Get Direct Link
- Report Inappropriate Content
Normality and Capability
Hi,
1) in Minitab I am able to test multiple variables for normality, can I do the same in JMP? - see picture - Prob_normality
2) In Minitab I can have Before and After, can I replicate for JMP? - see CPK Before and After
3) In CPk na Minitab you can see PPM for nonconformance instead of %, can I get also PPM instead?
Thank you
Michal
- Tags:
- windows
Accepted Solutions

- Mark as New
- Bookmark
- Subscribe
- Mute
- Subscribe to RSS Feed
- Get Direct Link
- Report Inappropriate Content
Re: Normality and Capability
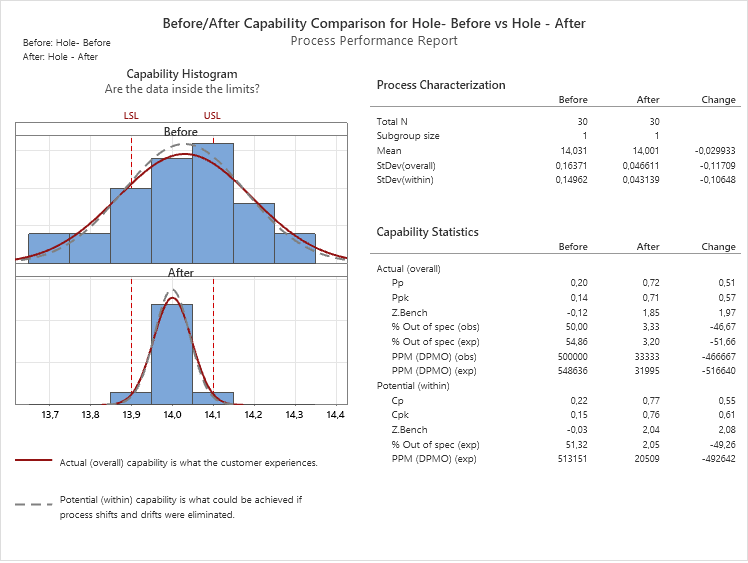
Maybe this will help.....attached is your data table in JMP. I have added a Value Order column property to the Before After column, and the Spec Limits column property to the Measurement column. The output display below can be regenerated by running the Before-After table script attached to the Data Table

- Mark as New
- Bookmark
- Subscribe
- Mute
- Subscribe to RSS Feed
- Get Direct Link
- Report Inappropriate Content
Re: Normality and Capability
If you want to replicate the Minitab report form, here is a very ruff, hardcoded version. It could be quite easily be put into a generic format and added as a JMP Addin. But I will leave that to your efforts

This is using only JSL, taking the objects from the output I previously provided, and then reformatting into the Minitab form. It needs a bunch of cleanup, and genericizing.
Here is the first pass at the code
Names Default To Here( 1 );
dt = Current Data Table();
dis = dt << Distribution( invisible,
	SendToByGroup( {:Before After == "Hole - Before"} ),
	Continuous Distribution( Column( :Measurement ), Process Capability( Use Column Property Specs ) ),
	By( :Before After ),
	Group Options( Layout( "Horizontal List" ) ),
	SendToByGroup(
		{:Before After == "Hole - Before"},
		SendToReport(
			Dispatch( {"Measurement", "Process Capability", "Measurement Capability", "Nonconformance"},
				"Observed PPM", NumberColBox,
				{Visibility( "Visible" )}
			)
		)
	),
	SendToByGroup(
		{:Before After == "Hole - After"},
		SendToReport(
			Dispatch( {"Measurement", "Process Capability", "Measurement Capability", "Histogram"},
				"Process Capability Analysis Histogram", FrameBox,
				{DispatchSeg( CustomStreamSeg( 1 ), {Font} )}
			),
			Dispatch( {"Measurement", "Process Capability", "Measurement Capability", "Nonconformance"},
				"Observed PPM", NumberColBox,
				{Visibility( "Visible" )}
			)
		)
	)
);

// Build the report

// Set the Histograms to the same axis
theMin = Min(
	Report( Dis[1] )["Histogram", AxisBox( 1 )] << get min,
	Report( Dis[2] )["Histogram", AxisBox( 1 )] << get min
);
theMax = Max(
	Report( Dis[1] )["Histogram", AxisBox( 1 )] << get max,
	Report( Dis[2] )["Histogram", AxisBox( 1 )] << get max
);
Report( Dis[1] )["Histogram", AxisBox( 1 )] << Min( theMin );
Report( Dis[1] )["Histogram", AxisBox( 1 )] << Max( theMax );
Report( Dis[2] )["Histogram", AxisBox( 1 )] << Min( theMin );
Report( Dis[2] )["Histogram", AxisBox( 1 )] << Max( theMax );
Summarize( dt, baGroups = by( :Before After ) );
nw = New Window( "Report",
	Outline Box( "Before/After Capability Comparison for " || baGroups[1] || " vs. " || baGroups[2],
		V List Box(
			H List Box(
				Text Box( "Before: " || baGroups[1] ),
				Spacer Box( size( 200, 0 ) ),
				Text Box( "Process Performance Report" )
			),
			Text Box( "After: " || baGroups[2] )
		),
		Spacer Box( size( 0, 5 ) ),
		Lineup Box( N Col( 2 ),
			Outline Box( "Capability Histogram",
				lub1 = Lineup Box( N Col( 1 ),
					H List Box( Spacer Box( size( 60, 0 ) ), Text Box( "Are the data inside the limits?" ) )
				)

			),
			V List Box(
				obPC = Outline Box( "Process Characterization" ),
				Spacer Box( size( 0, 15 ) ),
				obCS = Outline Box( "Capability Statistics" )
			)
		)
	)
);
lub1 << Append( Report( Dis[1] )["Histogram", framebox( 1 )] );
lub1 << Append(
	Border Box( top( 0 ), bottom( 0 ), Left( 0 ), Right( 0 ), sides( 15 ),
		Text Box( "                                          Before" )
	)
);
lub1 << Append(
	Border Box( top( 0 ), bottom( 0 ), Left( 0 ), Right( 0 ), sides( 15 ),
		Report( Dis[1] )["Histogram", framebox( 2 )]
	)
);
lub1 << Append(
	Border Box( top( 0 ), bottom( 0 ), Left( 0 ), Right( 0 ), sides( 15 ),
		Text Box( "                                          After" )
	)
);
lub1 << Append(
	Border Box( top( 0 ), bottom( 0 ), Left( 0 ), Right( 0 ), sides( 15 ),
		Report( Dis[2] )["Histogram", framebox( 2 )]
	)
);
lub1 << Append(
	Border Box( top( 0 ), bottom( 0 ), Left( 0 ), Right( 0 ), sides( 15 ),
		Report( Dis[1] )["Histogram", axisbox( 1 )]
	)
);

// Build Process Characterization table

beforePCList = Report( Dis[1] )["Process Summary", Number Col Box( 1 )] << get;
Remove From( beforePCList, 1, 2 );
Remove From( beforePCList, 5, 1 );
Insert Into( beforePCList, 1, 2 );
afterPCList = Report( Dis[2] )["Process Summary", Number Col Box( 1 )] << get;
Remove From( afterPCList, 1, 2 );
Remove From( afterPCList, 5, 1 );
Insert Into( afterPCList, 1, 2 );
changeList = {., .};
Insert Into( changeList, beforePCList[3] - afterPCList[3] );
Insert Into( changeList, beforePCList[4] - afterPCList[4] );
Insert Into( changeList, beforePCList[5] - afterPCList[5] );
obPC << append(
	Table Box(
		String Col Box( "", {"Total N", "Subgroup size", "Mean", "STDev(within)", "StDev(overall)"} ),
		Number Col Box( "Before", beforePCList ),
		Number Col Box( "After", afterPCList ),
		Number Col Box( "Change", changeList )
	)
);

beforeCSList = {.};
Insert Into( beforeCSList, (Report( Dis[1] )["Overall Sigma Capability", Number Col Box( 1 )] << get)[4] );
Insert Into( beforeCSList, (Report( Dis[1] )["Overall Sigma Capability", Number Col Box( 1 )] << get)[1] );
Insert Into( beforeCSList, . );
Insert Into( beforeCSList, (Report( Dis[1] )["Nonconformance", Number Col Box( 1 )] << get)[3] );
Insert Into( beforeCSList, (Report( Dis[1] )["Nonconformance", Number Col Box( 3 )] << get)[3] );
Insert Into( beforeCSList, (Report( Dis[1] )["Nonconformance", Number Col Box( 4 )] << get)[3] );
Insert Into( beforeCSList, beforeCSList[6] * 1000000 );
Insert Into( beforeCSList, . );
Insert Into( beforeCSList, (Report( Dis[1] )["Within Sigma Capability", Number Col Box( 1 )] << get)[4] );
Insert Into( beforeCSList, (Report( Dis[1] )["Within Sigma Capability", Number Col Box( 1 )] << get)[1] );
Insert Into( beforeCSList, . );
Insert Into( beforeCSList, (Report( Dis[1] )["Nonconformance", Number Col Box( 2 )] << get)[3] );
Insert Into( beforeCSList, Round( beforeCSList[13] * 1000000, 0 ) );

afterCSList = {.};
Insert Into( afterCSList, (Report( Dis[2] )["Overall Sigma Capability", Number Col Box( 1 )] << get)[4] );
Insert Into( afterCSLIST, (Report( Dis[2] )["Overall Sigma Capability", Number Col Box( 1 )] << get)[1] );
Insert Into( afterCSLIST, . );
Insert Into( afterCSLIST, (Report( Dis[2] )["Nonconformance", Number Col Box( 1 )] << get)[3] );
Insert Into( afterCSLIST, (Report( Dis[2] )["Nonconformance", Number Col Box( 3 )] << get)[3] );
Insert Into( afterCSLIST, (Report( Dis[2] )["Nonconformance", Number Col Box( 4 )] << get)[3] );
Insert Into( afterCSLIST, afterCSLIST[6] * 1000000 );
Insert Into( afterCSLIST, . );
Insert Into( afterCSLIST, (Report( Dis[2] )["Within Sigma Capability", Number Col Box( 1 )] << get)[4] );
Insert Into( afterCSLIST, (Report( Dis[2] )["Within Sigma Capability", Number Col Box( 1 )] << get)[1] );
Insert Into( afterCSLIST, . );
Insert Into( afterCSLIST, (Report( Dis[2] )["Nonconformance", Number Col Box( 2 )] << get)[3] );
Insert Into( afterCSLIST, Round( afterCSLIST[13] * 1000000, 0 ) );
change = Matrix( beforeCSList ) - Matrix( afterCSList );
obcs << append(
	Table Box(
		String Col Box( "",
			{"Actual (overall)", "    Pp", "    Ppk", "    Z Bench", "    % Out of spec (obs)",
			"    % Out of spec (exp)", "    PPM (DPMO) (obs)", "    PPM (DPMO) (exp)", "Potential (within)",
			"    Cp", "    Cpk", "    Z Bench", "    % Out of spec (exp)", "    PM (DPMO) (exp)"}
		),
		Number Col Box( "Before", beforeCSList ),
		Number Col Box( "After", afterCSList ),
		Number Col Box( "Change", change )
	)
);

dis << close window;

- Mark as New
- Bookmark
- Subscribe
- Mute
- Subscribe to RSS Feed
- Get Direct Link
- Report Inappropriate Content
Re: Normality and Capability
1. Yes. Use Analyze>Distribution, pick multiple variables. Hold down the CTRL key, and hold it. From one of the variable name red triangle menus, fit a continuous distribution, CTRL broadcasts this to all variables, keep holding CTRL, from the fitted distribution model red triangle menu, click goodness of fit test.
2. for before and after, put your phase column in the By role when you launch the distribution platform.

(I hope someone from JMP dev sees your example picture, it's much cleaner than JMP, and it's probably compatible with a clean paste into MS Word, and printable too. )
3. Right Click on the columns in the Nonconformance report, a menu pops up, click columns, and turn on the extra stats you need.

On the up-side, its easier to look at many variables in quickly in JMP, and the data is easily and dynamically linked back to the table.
Also, try the last option in Fit Continuous, it fits lots of distribution models and ranks them sequentially, then from any of the fit distributions RTM's choose process capability. You can get Cpk Ppk without transforming the data.
- Mark as New
- Bookmark
- Subscribe
- Mute
- Subscribe to RSS Feed
- Get Direct Link
- Report Inappropriate Content
Re: Normality and Capability
Hi,
1 and 3 is clear..working..can you be please more specific on 2?
Thanks
Michal

- Mark as New
- Bookmark
- Subscribe
- Mute
- Subscribe to RSS Feed
- Get Direct Link
- Report Inappropriate Content
Re: Normality and Capability
You should have a column in your JMP table with a title like before/after. When doing the Distribution platform, there is an option to fill out the By option. Use the before after column in the By option and you will get the distribution before and after.

- Mark as New
- Bookmark
- Subscribe
- Mute
- Subscribe to RSS Feed
- Get Direct Link
- Report Inappropriate Content
Re: Normality and Capability
For a thorough comparison to Minitab I suggest you read:
Moving From Minitab ® to JMP® : A Transition Guide, Version 2

- Mark as New
- Bookmark
- Subscribe
- Mute
- Subscribe to RSS Feed
- Get Direct Link
- Report Inappropriate Content
Re: Normality and Capability
concerning the issue with prob_normality, I encourage you to vote for
https://community.jmp.com/t5/JMP-Wish-List/Add-CDFs-to-Graph-Builder/idi-p/551634
also here I share Byron's hope:
@Byron_JMP wrote:I hope someone from JMP dev sees your example picture, it's much cleaner than JMP, and it's probably compatible with a clean paste into MS Word, and printable too.
Once CDF is available in Graph Builder, this gap to Minitab will be closed.
Maybe with JMP18.1?
And now?
for a collection of workarounds, please refer to how to make cumulative probability plots in JMP?
- Mark as New
- Bookmark
- Subscribe
- Mute
- Subscribe to RSS Feed
- Get Direct Link
- Report Inappropriate Content
Re: Normality and Capability
Hi,
despite having measurement in one column and status in second, I am not able to replicate what I can see in Minitab. Can you please share picture of the outcome?
Hole- Before 13,9445
Hole - After 13,9612
Hole- Before 14,031
Hole - After 14,0403
Hole- Before 14,2363
Hole - After 14,0423
Hole- Before 14,0605
Hole - After 13,9773
Hole- Before 14,2448
Hole - After 14,0903
Hole- Before 14,3006
Hole - After 13,9198
Hole- Before 14,0294
Hole - After 13,9568
Hole- Before 13,9381
Hole - After 13,9731
Hole- Before 14,1617
Hole - After 14,0621
Hole- Before 13,8853
Hole - After 14,0253
Hole- Before 14,0038
Hole - After 14,0468
Hole- Before 13,6758
Hole - After 14,0333
Hole- Before 13,6735
Hole - After 14,1074
Hole- Before 14,1156
Hole - After 14,0396
Hole- Before 14,2386
Hole - After 13,9335
Hole- Before 14,1268
Hole - After 13,9734
Hole- Before 13,8388
Hole - After 14,0022
Hole- Before 14,0422
Hole - After 13,9869
Hole- Before 13,9771
Hole - After 13,9939
Hole- Before 13,9529
Hole - After 14,0271
Hole- Before 14,0051
Hole - After 14,0045
Hole- Before 13,9315
Hole - After 13,972
Hole- Before 13,9159
Hole - After 13,9924
Hole- Before 14,0973
Hole - After 13,9723
Hole- Before 14,1115
Hole - After 13,9787
Hole- Before 14,0744
Hole - After 13,9936
Hole- Before 14,332
Hole - After 13,9986
Hole- Before 13,7861
Hole - After 14,041
Hole- Before 14,1448
Hole - After 13,902
Hole- Before 14,0634
Hole - After 13,9935
- Mark as New
- Bookmark
- Subscribe
- Mute
- Subscribe to RSS Feed
- Get Direct Link
- Report Inappropriate Content
Re: Normality and Capability
Please attach a JMP table. I have attached a JMP table from the JMP data sets. I have run the Distribution platform by machine. (there are many options). Click on the green arrow for the script to run.
- Mark as New
- Bookmark
- Subscribe
- Mute
- Subscribe to RSS Feed
- Get Direct Link
- Report Inappropriate Content
Re: Normality and Capability
Thanks, but you have logically 2 data sets, but I am searching for one overal comparing both like atatched
- Mark as New
- Bookmark
- Subscribe
- Mute
- Subscribe to RSS Feed
- Get Direct Link
- Report Inappropriate Content
Re: Normality and Capability
I don';t know how to get the specific column in the analysis that compares the two capability studies. As Jim has provided, the analysis of each is shown and you can do the comparison of values. I personally would not use this platform (or the one in Minitab) to do a comparison of processes before and after changes were made. Given two numbers, one will be bigger. So what?
Recommended Articles
- © 2026 JMP Statistical Discovery LLC. All Rights Reserved.
- Terms of Use
- Privacy Statement
- Contact Us