Turn on suggestions
Auto-suggest helps you quickly narrow down your search results by suggesting possible matches as you type.
- New to JMP? Join us Sept. 23-24 for the Early User Edition of Discovery Summit, tailor-made for new users. Register now for free!
- Your voice matters! Tell us how you prefer to receive JMP updates, so we can tailor our communication to your needs. Take short survey.
- See how to access JMP Marketplace - and - find, create & share add-ins to extend your JMP. Watch video.
Options
- Subscribe to RSS Feed
- Mark Topic as New
- Mark Topic as Read
- Float this Topic for Current User
- Bookmark
- Subscribe
- Mute
- Printer Friendly Page
Discussions
Solve problems, and share tips and tricks with other JMP users.- JMP User Community
- :
- Discussions
- :
- ANOM

Level II
- Mark as New
- Bookmark
- Subscribe
- Mute
- Subscribe to RSS Feed
- Get Direct Link
- Report Inappropriate Content
ANOM
Jul 15, 2024 06:31 AM
(3342 views)
I have an ANOM summary report I generated in JMP. I wanted to extract the Group means in each row of the report and save to a new data table (Run Chart) using JSL scripting, any help ?
- Tags:
- macOS
1 ACCEPTED SOLUTION
Accepted Solutions

Super User
Solution
- Mark as New
- Bookmark
- Subscribe
- Mute
- Subscribe to RSS Feed
- Get Direct Link
- Report Inappropriate Content
Re: ANOM
Below are few good options
- Use make into datatable and concatenate
- Get values into list/matrix, add as many rows as you have in those and use data table subscripting
And here is one possible script for the make into datatable + concatenate
Names Default To Here(1);
dt = Open("$SAMPLE_DATA/Drug.jmp");
dt_results = New Table("Results",
	Add Rows(0),
	New Column("FA", Character, Nominal),
	New Column("Pre", Numeric, Continuos),
	New Column("Post", Numeric, Continuos),
	New Column("Shift", Character, Nominal),
	New Column("Date", Numeric, Continuos)
);

ow = dt << Oneway(Y(:y), X(:Drug),
	ANOM(1, Show Summary Report(1), Point Options("Show Needles"))
);

tb = Report(ow)[Outline Box("Analysis of Means Summary"), Table Box(1)];
dt_ow = tb << Make Into Data Table;

Column(dt_ow, "Lower Limit") << Set Name("Pre");
Column(dt_ow, "Group Mean") << Set Name("Post");
dt_ow << Delete Columns({"Level", "Group N", "Upper Limit", "Limit Exceeded"});

dt_results << Concatenate(
	dt_ow,
	"Append To First Table"
);
Close(dt_ow, no save);
-Jarmo
4 REPLIES 4
Super User
- Mark as New
- Bookmark
- Subscribe
- Mute
- Subscribe to RSS Feed
- Get Direct Link
- Report Inappropriate Content
Re: ANOM
How does your run_chart_table look like? You could maybe use << Make Into Data table to the Oneway result table and concatenate that.
-Jarmo
Level II
- Mark as New
- Bookmark
- Subscribe
- Mute
- Subscribe to RSS Feed
- Get Direct Link
- Report Inappropriate Content
Re: ANOM
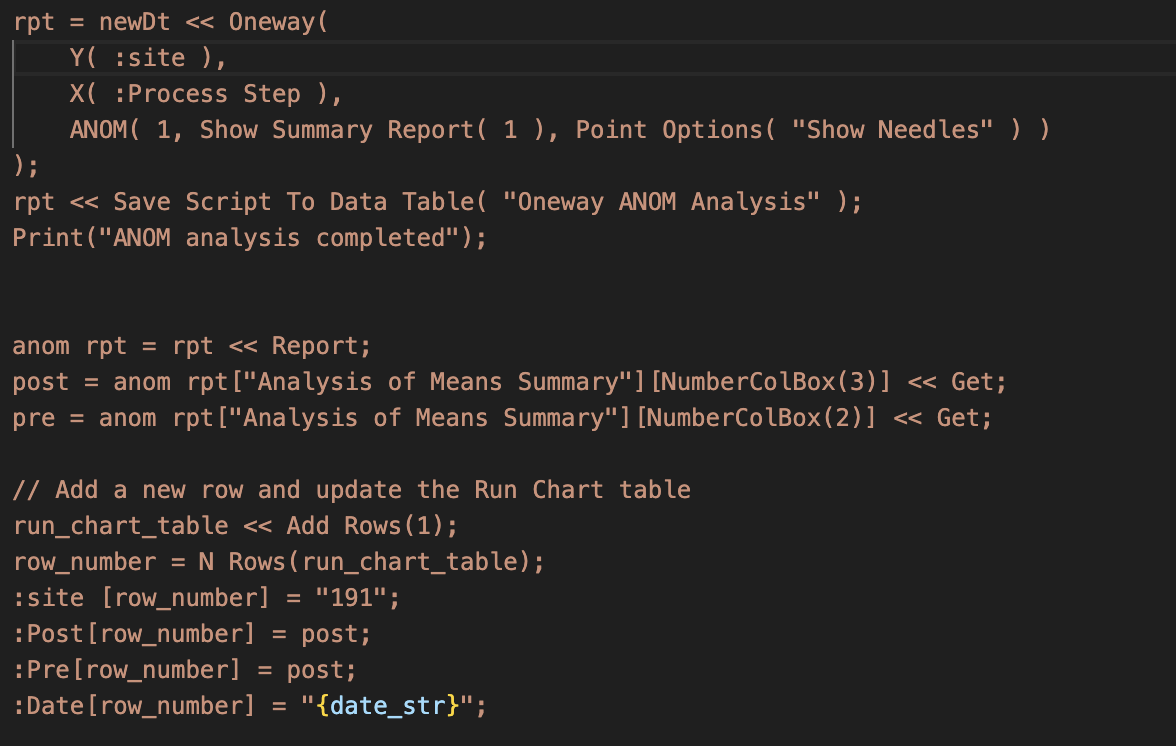
I want to assign the group means (pre and post group means ) from the anom summary report table to variables and then paste into pre and post columns of the data table below.


Super User
Solution
- Mark as New
- Bookmark
- Subscribe
- Mute
- Subscribe to RSS Feed
- Get Direct Link
- Report Inappropriate Content
Re: ANOM
Below are few good options
- Use make into datatable and concatenate
- Get values into list/matrix, add as many rows as you have in those and use data table subscripting
And here is one possible script for the make into datatable + concatenate
Names Default To Here(1);
dt = Open("$SAMPLE_DATA/Drug.jmp");
dt_results = New Table("Results",
	Add Rows(0),
	New Column("FA", Character, Nominal),
	New Column("Pre", Numeric, Continuos),
	New Column("Post", Numeric, Continuos),
	New Column("Shift", Character, Nominal),
	New Column("Date", Numeric, Continuos)
);

ow = dt << Oneway(Y(:y), X(:Drug),
	ANOM(1, Show Summary Report(1), Point Options("Show Needles"))
);

tb = Report(ow)[Outline Box("Analysis of Means Summary"), Table Box(1)];
dt_ow = tb << Make Into Data Table;

Column(dt_ow, "Lower Limit") << Set Name("Pre");
Column(dt_ow, "Group Mean") << Set Name("Post");
dt_ow << Delete Columns({"Level", "Group N", "Upper Limit", "Limit Exceeded"});

dt_results << Concatenate(
	dt_ow,
	"Append To First Table"
);
Close(dt_ow, no save);
-Jarmo
Level II
- Mark as New
- Bookmark
- Subscribe
- Mute
- Subscribe to RSS Feed
- Get Direct Link
- Report Inappropriate Content
Re: ANOM
Thanks jthi !
Recommended Articles
- © 2026 JMP Statistical Discovery LLC. All Rights Reserved.
- Terms of Use
- Privacy Statement
- Contact Us