- New to JMP? Join us Sept. 23-24 for the Early User Edition of Discovery Summit, tailor-made for new users. Register now for free!
- Your voice matters! Tell us how you prefer to receive JMP updates, so we can tailor our communication to your needs. Take short survey.
- See how to access JMP Marketplace - and - find, create & share add-ins to extend your JMP. Watch video.
- Subscribe to RSS Feed
- Mark Topic as New
- Mark Topic as Read
- Float this Topic for Current User
- Bookmark
- Subscribe
- Mute
- Printer Friendly Page
Discussions
Solve problems, and share tips and tricks with other JMP users.- JMP User Community
- :
- Discussions
- :
- Re: Normality and Capability

- Mark as New
- Bookmark
- Subscribe
- Mute
- Subscribe to RSS Feed
- Get Direct Link
- Report Inappropriate Content
Normality and Capability
Hi,
1) in Minitab I am able to test multiple variables for normality, can I do the same in JMP? - see picture - Prob_normality
2) In Minitab I can have Before and After, can I replicate for JMP? - see CPK Before and After
3) In CPk na Minitab you can see PPM for nonconformance instead of %, can I get also PPM instead?
Thank you
Michal
- Tags:
- windows

- Mark as New
- Bookmark
- Subscribe
- Mute
- Subscribe to RSS Feed
- Get Direct Link
- Report Inappropriate Content
Re: Normality and Capability
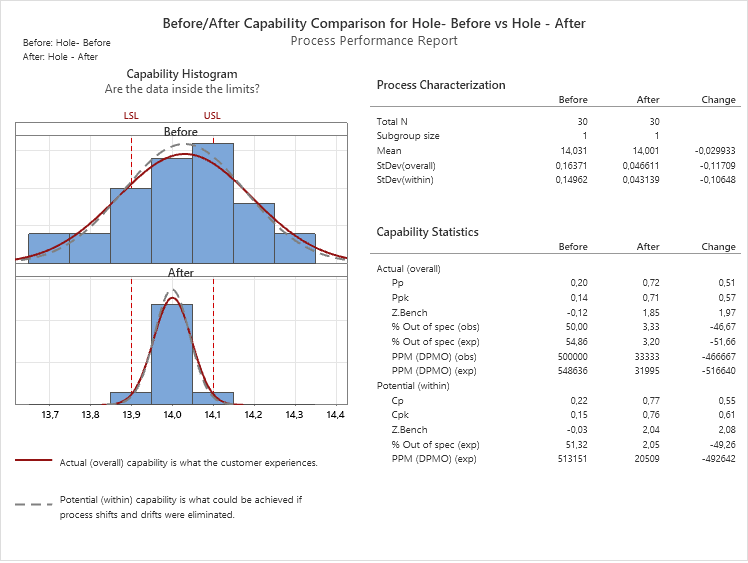
If you want to replicate the Minitab report form, here is a very ruff, hardcoded version. It could be quite easily be put into a generic format and added as a JMP Addin. But I will leave that to your efforts

This is using only JSL, taking the objects from the output I previously provided, and then reformatting into the Minitab form. It needs a bunch of cleanup, and genericizing.
Here is the first pass at the code
Names Default To Here( 1 );
dt = Current Data Table();
dis = dt << Distribution( invisible,
	SendToByGroup( {:Before After == "Hole - Before"} ),
	Continuous Distribution( Column( :Measurement ), Process Capability( Use Column Property Specs ) ),
	By( :Before After ),
	Group Options( Layout( "Horizontal List" ) ),
	SendToByGroup(
		{:Before After == "Hole - Before"},
		SendToReport(
			Dispatch( {"Measurement", "Process Capability", "Measurement Capability", "Nonconformance"},
				"Observed PPM", NumberColBox,
				{Visibility( "Visible" )}
			)
		)
	),
	SendToByGroup(
		{:Before After == "Hole - After"},
		SendToReport(
			Dispatch( {"Measurement", "Process Capability", "Measurement Capability", "Histogram"},
				"Process Capability Analysis Histogram", FrameBox,
				{DispatchSeg( CustomStreamSeg( 1 ), {Font} )}
			),
			Dispatch( {"Measurement", "Process Capability", "Measurement Capability", "Nonconformance"},
				"Observed PPM", NumberColBox,
				{Visibility( "Visible" )}
			)
		)
	)
);

// Build the report

// Set the Histograms to the same axis
theMin = Min(
	Report( Dis[1] )["Histogram", AxisBox( 1 )] << get min,
	Report( Dis[2] )["Histogram", AxisBox( 1 )] << get min
);
theMax = Max(
	Report( Dis[1] )["Histogram", AxisBox( 1 )] << get max,
	Report( Dis[2] )["Histogram", AxisBox( 1 )] << get max
);
Report( Dis[1] )["Histogram", AxisBox( 1 )] << Min( theMin );
Report( Dis[1] )["Histogram", AxisBox( 1 )] << Max( theMax );
Report( Dis[2] )["Histogram", AxisBox( 1 )] << Min( theMin );
Report( Dis[2] )["Histogram", AxisBox( 1 )] << Max( theMax );
Summarize( dt, baGroups = by( :Before After ) );
nw = New Window( "Report",
	Outline Box( "Before/After Capability Comparison for " || baGroups[1] || " vs. " || baGroups[2],
		V List Box(
			H List Box(
				Text Box( "Before: " || baGroups[1] ),
				Spacer Box( size( 200, 0 ) ),
				Text Box( "Process Performance Report" )
			),
			Text Box( "After: " || baGroups[2] )
		),
		Spacer Box( size( 0, 5 ) ),
		Lineup Box( N Col( 2 ),
			Outline Box( "Capability Histogram",
				lub1 = Lineup Box( N Col( 1 ),
					H List Box( Spacer Box( size( 60, 0 ) ), Text Box( "Are the data inside the limits?" ) )
				)

			),
			V List Box(
				obPC = Outline Box( "Process Characterization" ),
				Spacer Box( size( 0, 15 ) ),
				obCS = Outline Box( "Capability Statistics" )
			)
		)
	)
);
lub1 << Append( Report( Dis[1] )["Histogram", framebox( 1 )] );
lub1 << Append(
	Border Box( top( 0 ), bottom( 0 ), Left( 0 ), Right( 0 ), sides( 15 ),
		Text Box( "                                          Before" )
	)
);
lub1 << Append(
	Border Box( top( 0 ), bottom( 0 ), Left( 0 ), Right( 0 ), sides( 15 ),
		Report( Dis[1] )["Histogram", framebox( 2 )]
	)
);
lub1 << Append(
	Border Box( top( 0 ), bottom( 0 ), Left( 0 ), Right( 0 ), sides( 15 ),
		Text Box( "                                          After" )
	)
);
lub1 << Append(
	Border Box( top( 0 ), bottom( 0 ), Left( 0 ), Right( 0 ), sides( 15 ),
		Report( Dis[2] )["Histogram", framebox( 2 )]
	)
);
lub1 << Append(
	Border Box( top( 0 ), bottom( 0 ), Left( 0 ), Right( 0 ), sides( 15 ),
		Report( Dis[1] )["Histogram", axisbox( 1 )]
	)
);

// Build Process Characterization table

beforePCList = Report( Dis[1] )["Process Summary", Number Col Box( 1 )] << get;
Remove From( beforePCList, 1, 2 );
Remove From( beforePCList, 5, 1 );
Insert Into( beforePCList, 1, 2 );
afterPCList = Report( Dis[2] )["Process Summary", Number Col Box( 1 )] << get;
Remove From( afterPCList, 1, 2 );
Remove From( afterPCList, 5, 1 );
Insert Into( afterPCList, 1, 2 );
changeList = {., .};
Insert Into( changeList, beforePCList[3] - afterPCList[3] );
Insert Into( changeList, beforePCList[4] - afterPCList[4] );
Insert Into( changeList, beforePCList[5] - afterPCList[5] );
obPC << append(
	Table Box(
		String Col Box( "", {"Total N", "Subgroup size", "Mean", "STDev(within)", "StDev(overall)"} ),
		Number Col Box( "Before", beforePCList ),
		Number Col Box( "After", afterPCList ),
		Number Col Box( "Change", changeList )
	)
);

beforeCSList = {.};
Insert Into( beforeCSList, (Report( Dis[1] )["Overall Sigma Capability", Number Col Box( 1 )] << get)[4] );
Insert Into( beforeCSList, (Report( Dis[1] )["Overall Sigma Capability", Number Col Box( 1 )] << get)[1] );
Insert Into( beforeCSList, . );
Insert Into( beforeCSList, (Report( Dis[1] )["Nonconformance", Number Col Box( 1 )] << get)[3] );
Insert Into( beforeCSList, (Report( Dis[1] )["Nonconformance", Number Col Box( 3 )] << get)[3] );
Insert Into( beforeCSList, (Report( Dis[1] )["Nonconformance", Number Col Box( 4 )] << get)[3] );
Insert Into( beforeCSList, beforeCSList[6] * 1000000 );
Insert Into( beforeCSList, . );
Insert Into( beforeCSList, (Report( Dis[1] )["Within Sigma Capability", Number Col Box( 1 )] << get)[4] );
Insert Into( beforeCSList, (Report( Dis[1] )["Within Sigma Capability", Number Col Box( 1 )] << get)[1] );
Insert Into( beforeCSList, . );
Insert Into( beforeCSList, (Report( Dis[1] )["Nonconformance", Number Col Box( 2 )] << get)[3] );
Insert Into( beforeCSList, Round( beforeCSList[13] * 1000000, 0 ) );

afterCSList = {.};
Insert Into( afterCSList, (Report( Dis[2] )["Overall Sigma Capability", Number Col Box( 1 )] << get)[4] );
Insert Into( afterCSLIST, (Report( Dis[2] )["Overall Sigma Capability", Number Col Box( 1 )] << get)[1] );
Insert Into( afterCSLIST, . );
Insert Into( afterCSLIST, (Report( Dis[2] )["Nonconformance", Number Col Box( 1 )] << get)[3] );
Insert Into( afterCSLIST, (Report( Dis[2] )["Nonconformance", Number Col Box( 3 )] << get)[3] );
Insert Into( afterCSLIST, (Report( Dis[2] )["Nonconformance", Number Col Box( 4 )] << get)[3] );
Insert Into( afterCSLIST, afterCSLIST[6] * 1000000 );
Insert Into( afterCSLIST, . );
Insert Into( afterCSLIST, (Report( Dis[2] )["Within Sigma Capability", Number Col Box( 1 )] << get)[4] );
Insert Into( afterCSLIST, (Report( Dis[2] )["Within Sigma Capability", Number Col Box( 1 )] << get)[1] );
Insert Into( afterCSLIST, . );
Insert Into( afterCSLIST, (Report( Dis[2] )["Nonconformance", Number Col Box( 2 )] << get)[3] );
Insert Into( afterCSLIST, Round( afterCSLIST[13] * 1000000, 0 ) );
change = Matrix( beforeCSList ) - Matrix( afterCSList );
obcs << append(
	Table Box(
		String Col Box( "",
			{"Actual (overall)", "    Pp", "    Ppk", "    Z Bench", "    % Out of spec (obs)",
			"    % Out of spec (exp)", "    PPM (DPMO) (obs)", "    PPM (DPMO) (exp)", "Potential (within)",
			"    Cp", "    Cpk", "    Z Bench", "    % Out of spec (exp)", "    PM (DPMO) (exp)"}
		),
		Number Col Box( "Before", beforeCSList ),
		Number Col Box( "After", afterCSList ),
		Number Col Box( "Change", change )
	)
);

dis << close window;
- Mark as New
- Bookmark
- Subscribe
- Mute
- Subscribe to RSS Feed
- Get Direct Link
- Report Inappropriate Content
Re: Normality and Capability
Maybe this will help.....attached is your data table in JMP. I have added a Value Order column property to the Before After column, and the Spec Limits column property to the Measurement column. The output display below can be regenerated by running the Before-After table script attached to the Data Table

- Mark as New
- Bookmark
- Subscribe
- Mute
- Subscribe to RSS Feed
- Get Direct Link
- Report Inappropriate Content
Re: Normality and Capability
Hi Jim,
thank you a lot. Good help.
- « Previous
-
- 1
- 2
- Next »
Recommended Articles
- © 2026 JMP Statistical Discovery LLC. All Rights Reserved.
- Terms of Use
- Privacy Statement
- Contact Us