- New to JMP? Join us Sept. 23-24 for the Early User Edition of Discovery Summit, tailor-made for new users. Register now for free!
- Your voice matters! Tell us how you prefer to receive JMP updates, so we can tailor our communication to your needs. Take short survey.
- See how to access JMP Marketplace - and - find, create & share add-ins to extend your JMP. Watch video.
- Subscribe to RSS Feed
- Mark Topic as New
- Mark Topic as Read
- Float this Topic for Current User
- Bookmark
- Subscribe
- Mute
- Printer Friendly Page
Discussions
Solve problems, and share tips and tricks with other JMP users.- JMP User Community
- :
- Discussions
- :
- Normal Two Mixture Distribution Labeling

- Mark as New
- Bookmark
- Subscribe
- Mute
- Subscribe to RSS Feed
- Get Direct Link
- Report Inappropriate Content
Normal Two Mixture Distribution Labeling
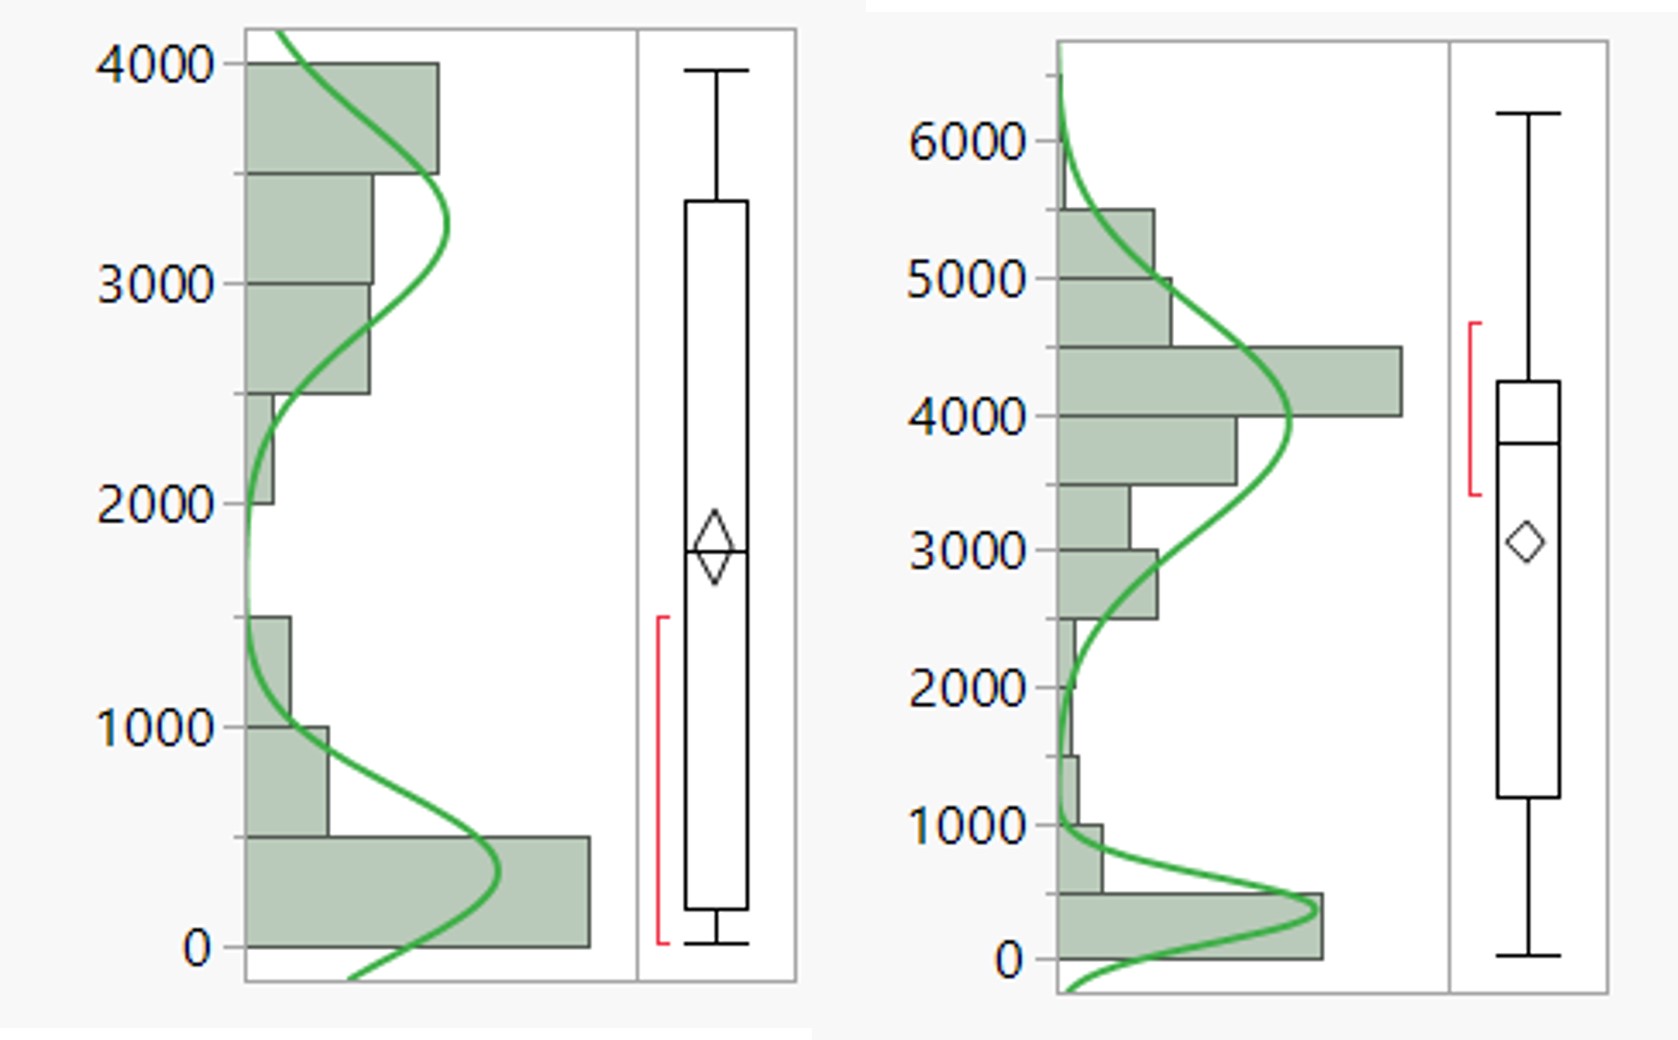
There are parts that have a normal two mixture distribution (I have included two examples of the type of distributions that I am seeing in the attachment below). I would like to label the parts based on whether they are included in the first or second part of the distribution. Is there a way to do this?
- Tags:
- windows
Accepted Solutions

- Mark as New
- Bookmark
- Subscribe
- Mute
- Subscribe to RSS Feed
- Get Direct Link
- Report Inappropriate Content
Re: Normal Two Mixture Distribution Labeling
Hi @dkraeuter_sunne,
May I suggest to have a look at Normal Mixtures clustering ? It may be very appropriate and relevant for what you intend to do, as you would like to group points based on distribution similarity.
I tried to reproduce the type of distribution you have :

When you go to Analyze, Clustering, Normal Mixtures and specify your distribution as Y and the number of clusters to 2, you can find these results :

From there, you can save the probabilities of each point belonging to each cluster (in the red triangle options, "save cluster formula" to get the labels about first or second part of the distribution and "save mixture probabilities" to have more details about the cluster decision).
More info and explanations on Normal Mixtures clustering : Clustering methods for unsupervised machine learning (jmp.com)
Attached you'll find the toy dataset I created and used, I hope it will help you.
"It is not unusual for a well-designed experiment to analyze itself" (Box, Hunter and Hunter)

- Mark as New
- Bookmark
- Subscribe
- Mute
- Subscribe to RSS Feed
- Get Direct Link
- Report Inappropriate Content
Re: Normal Two Mixture Distribution Labeling
After you fit a 2-normal mixture, you should get mu1, mu2, sigma1, sigma2, p1, p2, such that the fitted distribution is defined as: F(x) = p1 * Normal Distribution(x, mu1, sigma1) + p2 * Normal Distribution(x, mu2, sigma2).
The Density function is: f(x) = p1 * Normal Density(x, mu1, sigma1) + p2 * Normal Density(x, mu2, sigma2).
One approach to define the label is by comparing p1 * Normal Density(x, mu1, sigma1) and p2 * Normal Density(x, mu2, sigma2). If the first one is larger, assign 1, otherwise, 2.
Therefore, you can create a formula column to calculate that.
Meanwhile, that approach has been implemented in Life Distribution's "Fit Mixture". After fitting a mixture, use "Save Predictions" to get the p1 * Normal Density(x, mu1, sigma1) and p2 * Normal Density(x, mu2, sigma2). And it is up to you how to handle it. You can use a simple comparison like what I described. Or you can use the values in more sophisticated ways.

- Mark as New
- Bookmark
- Subscribe
- Mute
- Subscribe to RSS Feed
- Get Direct Link
- Report Inappropriate Content
Re: Normal Two Mixture Distribution Labeling
Hi @dkraeuter_sunne,
May I suggest to have a look at Normal Mixtures clustering ? It may be very appropriate and relevant for what you intend to do, as you would like to group points based on distribution similarity.
I tried to reproduce the type of distribution you have :
When you go to Analyze, Clustering, Normal Mixtures and specify your distribution as Y and the number of clusters to 2, you can find these results :
From there, you can save the probabilities of each point belonging to each cluster (in the red triangle options, "save cluster formula" to get the labels about first or second part of the distribution and "save mixture probabilities" to have more details about the cluster decision).
More info and explanations on Normal Mixtures clustering : Clustering methods for unsupervised machine learning (jmp.com)
Attached you'll find the toy dataset I created and used, I hope it will help you.
"It is not unusual for a well-designed experiment to analyze itself" (Box, Hunter and Hunter)
- Mark as New
- Bookmark
- Subscribe
- Mute
- Subscribe to RSS Feed
- Get Direct Link
- Report Inappropriate Content
Re: Normal Two Mixture Distribution Labeling
Thanks, @Victor_G Good to know that function. And the clustering bakes the decision rule directly in the result!
Recommended Articles
- © 2026 JMP Statistical Discovery LLC. All Rights Reserved.
- Terms of Use
- Privacy Statement
- Contact Us