- JMP Statement Regarding Critical PHP Remote Code Execution Vulnerabilities (CVE-2026-109618, CVE-2026-109619)
- Don’t miss your chance to experience Discovery Summit Europe at our best available rate! Early bird registration through 31 Oct.
- Graph Builder Toolbar streamlines interactive graphing. Creates shortcuts on Report and GraphBuilder Helpers toolbars. Download and install the extension.
- Subscribe to RSS Feed
- Mark Topic as New
- Mark Topic as Read
- Float this Topic for Current User
- Bookmark
- Subscribe
- Mute
- Printer Friendly Page
Discussions
Solve problems, and share tips and tricks with other JMP users.- User Community
- :
- Discussions
- :
- Non-Parametric-Test (JMP 17.2) Beginners Question

- Mark as New
- Bookmark
- Subscribe
- Mute
- Subscribe to RSS Feed
- Get Direct Link
- Report Inappropriate Content
Non-Parametric-Test (JMP 17.2) Beginners Question
Hallo liebe Community,
ich habe eine ziemlich basale Statistik Frage:
Ich habe ein "Medikament A", das nehmen etwa 200 Patienten ein
Jetzt möchte ich die Gruppen vergleichen:
Nebenwirkung B "Present" oder "Absent"
Welchen Test verwende ich da? Ich dachte non-parametric über fit y to x und Wilcoxon-Test mit zwei Stichproben, Normal-Approxmation unter "Wahrscheinlichkeit > Z" den P-Value ablesen, um festzustellen ob der beobachtete Unterschied signifikant ist oder nicht.
Stimmt das denn so? Stehe etwas auf dem Schlauch gerade.
Vielen Dank!
- Mark as New
- Bookmark
- Subscribe
- Mute
- Subscribe to RSS Feed
- Get Direct Link
- Report Inappropriate Content
Betreff: Non-Parametric-Test (JMP 17.2) Beginners Question
Kurzer Zusatz: Ich ermittle die Median Dosis bei je "Present" und "Absent" und vergleiche dann die Gruppe


- Mark as New
- Bookmark
- Subscribe
- Mute
- Subscribe to RSS Feed
- Get Direct Link
- Report Inappropriate Content
Betreff: Non-Parametric-Test (JMP 17.2) Beginners Question
Hi @mmkaz : For clarity, does your data look something like the following or am I missing something?

- Mark as New
- Bookmark
- Subscribe
- Mute
- Subscribe to RSS Feed
- Get Direct Link
- Report Inappropriate Content
Betreff: Non-Parametric-Test (JMP 17.2) Beginners Question
Genau so!
- Mark as New
- Bookmark
- Subscribe
- Mute
- Subscribe to RSS Feed
- Get Direct Link
- Report Inappropriate Content
Betreff: Non-Parametric-Test (JMP 17.2) Beginners Question
Hi @mmkaz : OK. Using the Distribution platform, put Side Effect B in for Y as shown below.

Then click on the red triangle and choose choose "Confidence Interval" as shown below (I selected 95%).

You will the get a confidence interval for each (as shown below)
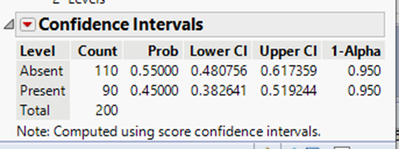
In this example case, 55% of this sample of 200 patients did not experience this side effect. The 95% CI is 48.1% to 61.7%. This basically means that in the entire population of patients (what you are really interested in), the percent who do not experience this side effect could be as low as 48.1% and as high as 61.7% (with 95% confidence).
You don't need to look at both Levels (since %Present = 100 - %Absent) . Pick the Level of interest and focus there.
Questions? Come back,
Recommended Articles
- © 2026 JMP Statistical Discovery LLC. All Rights Reserved.
- Terms of Use
- Privacy Statement
- Contact Us