- Instantly extract effect sizes, F-ratios, and FDR-adjusted p-values from your models with the Calculate Effects Sizes extension, available now in the JMP Marketplace!
- New to JMP? Join us Sept. 23-24 for the Early User Edition of Discovery Summit, tailor-made for new users. Register now for free!
- See how to use the JMP Marketplace – Free tools to expand JMP capabilities. Register. July 10, 2 pm US Eastern Time.
- Subscribe to RSS Feed
- Mark Topic as New
- Mark Topic as Read
- Float this Topic for Current User
- Bookmark
- Subscribe
- Mute
- Printer Friendly Page
Discussions
Solve problems, and share tips and tricks with other JMP users.- JMP User Community
- :
- Discussions
- :
- Re: Non Normal Data Transformation(Capability Analysis)

- Mark as New
- Bookmark
- Subscribe
- Mute
- Subscribe to RSS Feed
- Get Direct Link
- Report Inappropriate Content
Non Normal Data Transformation(Capability Analysis)
Hello All,
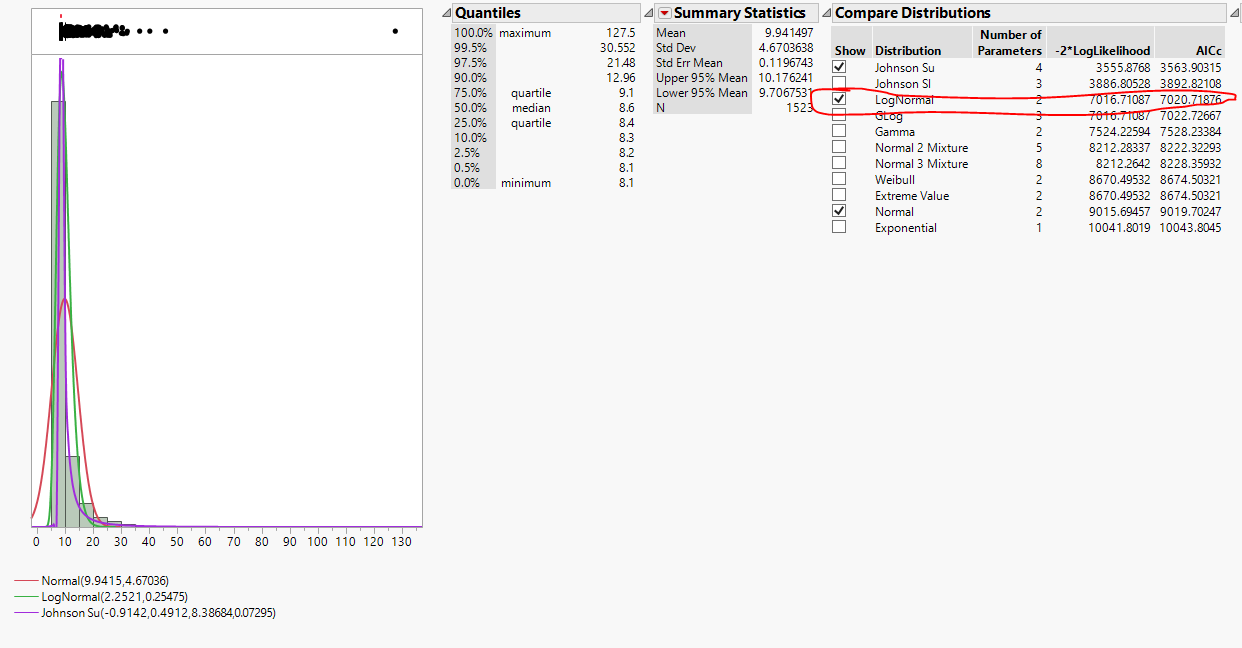
I have a lot of Non-normal Data so i read how to use Continuous fit and Fit All,please see below Eg. Figure 1.
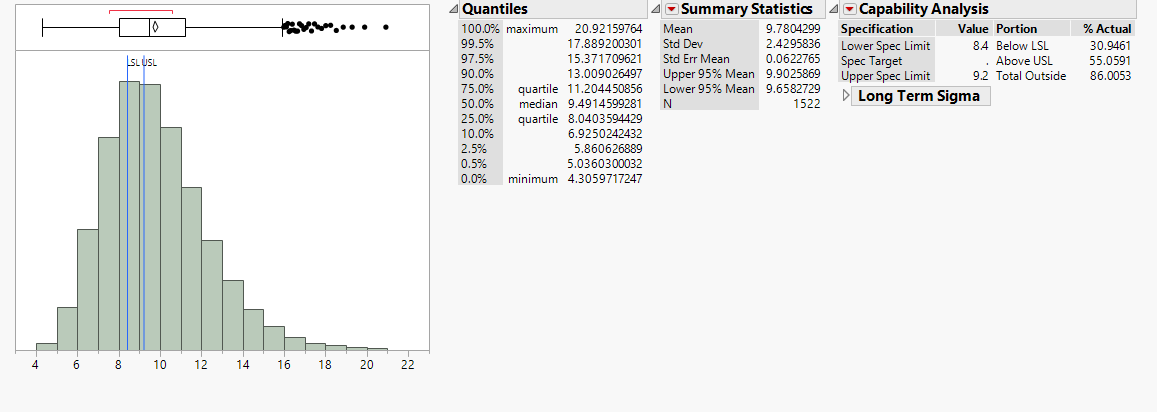
Now I have to enforce our Specs of 8.4-9.2 , so first i transformed the data by picking Log Normal (Using"Save Fitted Quantile") Figure-2 because Johnson-Si & Johnson Su showed a very weird peak.
Now i am wondering :
1) Did i pick the correct transformation
2) If yes, do i need to transform the Spec values of 8.4 & 9.2
3) Is it correct to use the capability analysis on transformed data as the data is still not normal (shown by Goodness of Fit)
Please advise
Thanks in advance
Accepted Solutions

- Mark as New
- Bookmark
- Subscribe
- Mute
- Subscribe to RSS Feed
- Get Direct Link
- Report Inappropriate Content
Re: Non Normal Data Transformation(Capability Analysis)
OK...here's a thought for you. Have you considered running a designed experiment where the levels of the characteristic in question at the 1 and 99% quantiles of your data range are starting values for high and low for that factor? And maybe add some other factors that are relevant for the key output characteristics? Of course you'd have to use the variable you've plotted here as a factor and not a response within the context of the experiment. And find some meaningful fitness for use characteristics driven by perhaps customer end use needs. You don't even have to run a multi factor experiment...although it could yield enormously valuable information...especially if this single factor interacts with others that are influential in the process overall. I'll also send you a private message.

- Mark as New
- Bookmark
- Subscribe
- Mute
- Subscribe to RSS Feed
- Get Direct Link
- Report Inappropriate Content
Re: Non Normal Data Transformation(Capability Analysis)
You did not mention which version of JMP or JMPPro you are using. The link below provides a step by step example if you have the Process Capability platform on your PC. You have the option to Set Distribution or use Best Fit. PPK, using maximum likelihood estimates of percentiles is an often used choice.
Note, PPK as well as Cpk calculations, assume identically and independently distributed data ( IID ), meaning no systematic variations.
Hope this helps.
JMP Documentation for Nonnormal-capability-analysis

- Mark as New
- Bookmark
- Subscribe
- Mute
- Subscribe to RSS Feed
- Get Direct Link
- Report Inappropriate Content
Re: Non Normal Data Transformation(Capability Analysis)
I am using JMP 14.
I did use the above method its very helpful and intuitive

- Mark as New
- Bookmark
- Subscribe
- Mute
- Subscribe to RSS Feed
- Get Direct Link
- Report Inappropriate Content
Re: Non Normal Data Transformation(Capability Analysis)
I think a 'best practice' is to select a distribution model based on knowledge about the process that generates the data, rather than 'best fit' criteria. The criteria are based on a single sample. The knowledge is based on the population.
Note that if you fit the distribution in the Distribution platform, the red triangle menu for the fitted model contains a command to initiate a process capability analysis for the non-normal distribution. You do not need to transform your specification limits in this case.
- Mark as New
- Bookmark
- Subscribe
- Mute
- Subscribe to RSS Feed
- Get Direct Link
- Report Inappropriate Content
Re: Non Normal Data Transformation(Capability Analysis)
I guess I wouldn't get too hung up on worrying about which transform, any process capability index, or any other statistic associated with the practical problem at hand. The process is woefully incapable...a conclusion that isn't 'statistical' in nature...but a cursory inspection of the data untransformed with spec limits overlaid shows that the preponderance of data is outside the spec limits. I'm presuming your process is steady and stable, devoid of assignable cause variation. If that's the case, now on to the hard part...either reducing variation. Or maybe a first step is questioning the validity and applicability of the specification limits. Do they reflect some real life criteria? Regulatory, supplier driven, customer driven, industry standards/specs driven? Or were they determined by the 'we really have no idea what appropriate tolerance values should be...so in an effort to force manufacturing to 'aim', we'll just use aim as the center of the spec range...and go plus or minus 10% from there.'
Don't laugh...I saw this thinking applied often in industry.
- Mark as New
- Bookmark
- Subscribe
- Mute
- Subscribe to RSS Feed
- Get Direct Link
- Report Inappropriate Content
Re: Non Normal Data Transformation(Capability Analysis)
I did make me Laugh, as the Spec limits have been in fact designed the way you said for above process,
So our challenge at hand is to challenge the limits and rethink whether these are applicable or not in real world.
We tested for Normality which it doesn't passes.
I read a lot on using Control Charts with Non-Normal Data and i know that we can use Control chart irrespective of the nature of the data.
So, now i have Control Limits based on the data in hand.
I wish to use those limits and compute the Capability Indices and make a comparison between the Spec Limits and Control Limits.
- Mark as New
- Bookmark
- Subscribe
- Mute
- Subscribe to RSS Feed
- Get Direct Link
- Report Inappropriate Content
Re: Non Normal Data Transformation(Capability Analysis)
OK...here's a thought for you. Have you considered running a designed experiment where the levels of the characteristic in question at the 1 and 99% quantiles of your data range are starting values for high and low for that factor? And maybe add some other factors that are relevant for the key output characteristics? Of course you'd have to use the variable you've plotted here as a factor and not a response within the context of the experiment. And find some meaningful fitness for use characteristics driven by perhaps customer end use needs. You don't even have to run a multi factor experiment...although it could yield enormously valuable information...especially if this single factor interacts with others that are influential in the process overall. I'll also send you a private message.
Recommended Articles
- © 2026 JMP Statistical Discovery LLC. All Rights Reserved.
- Terms of Use
- Privacy Statement
- Contact Us