- New to JMP? Join us Sept. 23-24 for the Early User Edition of Discovery Summit, tailor-made for new users. Register now for free!
- Use World Cup data to build models, explore spatial relationships, and create informative visualizations in JMP. Register. July 17, 2 pm US Eastern Time.
- Your voice matters! Tell us how you prefer to receive JMP updates, so we can tailor our communication to your needs. Take short survey.
- Subscribe to RSS Feed
- Mark Topic as New
- Mark Topic as Read
- Float this Topic for Current User
- Bookmark
- Subscribe
- Mute
- Printer Friendly Page
Discussions
Solve problems, and share tips and tricks with other JMP users.- JMP User Community
- :
- Discussions
- :
- Nomological validity

- Mark as New
- Bookmark
- Subscribe
- Mute
- Subscribe to RSS Feed
- Get Direct Link
- Report Inappropriate Content
Nomological validity
Hello wonderful community!
I have almost finished my analyzes, but I need to check the nomological validity of my measurement scale. I have read on the subject, but I don't understand how to do it in JMP Pro 16.
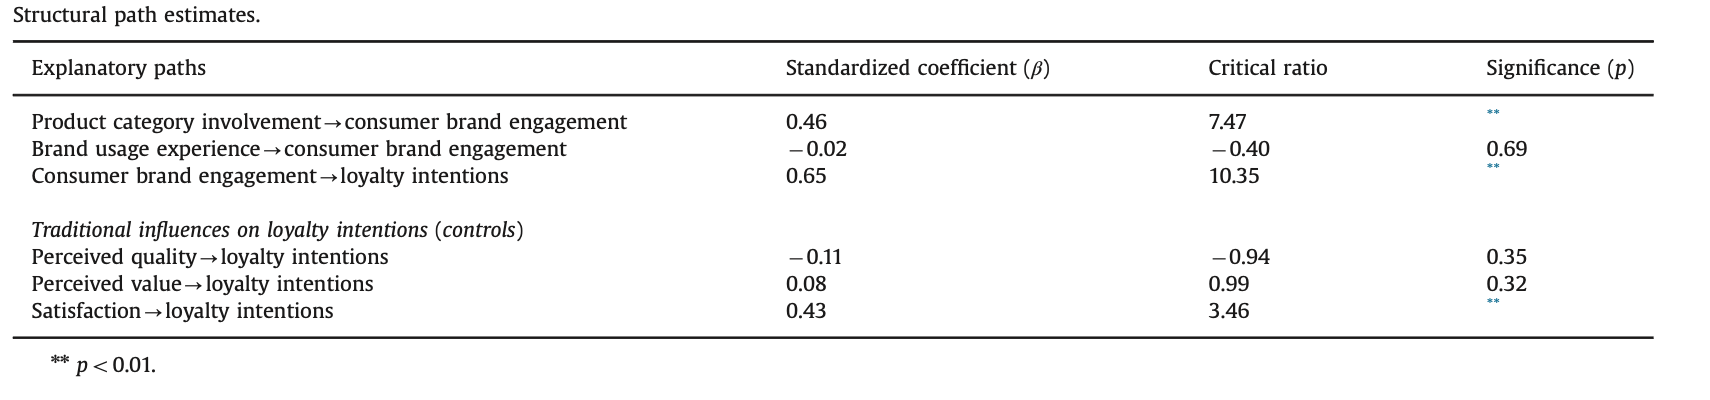
I would like to make a table like the one in attachment. Could you help me please?
Thank you very much!
Nataly :)

- Mark as New
- Bookmark
- Subscribe
- Mute
- Subscribe to RSS Feed
- Get Direct Link
- Report Inappropriate Content
Re: Nomological validity
Hi Nataly,
I think that you will need to provide more information about your analysis. I assume that the example you have attached is from a structural equation model. But it would be useful if you could explain where it came from and how what you are trying to do relates to this.
Regards,
Phil

- Mark as New
- Bookmark
- Subscribe
- Mute
- Subscribe to RSS Feed
- Get Direct Link
- Report Inappropriate Content
Re: Nomological validity
Hi Nataly,
As Phil indicated, it'd be helpful to have more clarity on the analyses you performed. From an older question you asked, I assume you fit a confirmatory factor analysis (CFA) model with 3 latent variables (the subscales of your measurement scale).
Generally speaking, one effective way to test the convergent and discriminant validity of your scale is to fit another CFA using your scale and also a couple other scales that should and shouldn't covary with yours. Your CFA should have as many latent variables (LVs) as you think your scale is measuring plus the LVs of the other scales, and all LVs should covary. Then, after fitting the model, in the red triangle menu you'll find "Assess Measurement Model," which will display the reliability of your indicators and your subscales. It'll also display a "Construct Validity Matrix" along with a visualization of the matrix. Your goal is to show that the diagonal entries in that matrix are larger than the values above and to the right of them. The reason is that the diagonal values are the Average Variance Extracted by the LVs from the indicators and the values above and to the right represent the variance shared across the LVs. You want to make sure that your LVs (subscales) have more variance in common with their own indicators than with the other LVs, and this is evidenced by having larger values in the diagonal. You can also examine the values below the diagonal, which are simply the correlations between LVs--those that you hypothesize to correlate with your scale's LVs should show those associations and those you hypothesize to not correlate with your scale's LVs should also show that pattern.
Here's an example where the latent variables (all but Reputation) are well-defined and have good convergent and discriminant validity:

There's a more detailed explanation of the Assess Measurement Model option in this video presentation starting at minute 31: https://community.jmp.com/t5/Discovery-Summit-Americas-2020/ABCs-of-Structural-Equations-Models-2020...
HTH,
~Laura
Recommended Articles
- © 2026 JMP Statistical Discovery LLC. All Rights Reserved.
- Terms of Use
- Privacy Statement
- Contact Us