- Subscribe to RSS Feed
- Mark Topic as New
- Mark Topic as Read
- Float this Topic for Current User
- Bookmark
- Subscribe
- Mute
- Printer Friendly Page
Discussions
Solve problems, and share tips and tricks with other JMP users.- JMP User Community
- :
- Discussions
- :
- Re: Multivariate vs. Graph builder
- Mark as New
- Bookmark
- Subscribe
- Mute
- Subscribe to RSS Feed
- Get Direct Link
- Report Inappropriate Content
Multivariate vs. Graph builder
Hi,
When I try to find correlation between Age and Height by using multivariate analysis R2=0.9807
When I apply the same thing by using Graph Builder R2=0.962
What is the reason of this change. This difference will be increase based on results.
Could someone help on this?
You can also see jmp file on enclosed.
- Mark as New
- Bookmark
- Subscribe
- Mute
- Subscribe to RSS Feed
- Get Direct Link
- Report Inappropriate Content
Re: Multivariate vs. Graph builder
I verified the Pearson linear correlation coefficient = 0.9807 from Multivariate with Bivariate and by hand. I do not know how the estimate provided by Graph Builder is calculated. You might send this example to JMP Technical Support (support@jmp.com) for investigation. Please report here what you learn.
- Mark as New
- Bookmark
- Subscribe
- Mute
- Subscribe to RSS Feed
- Get Direct Link
- Report Inappropriate Content
Re: Multivariate vs. Graph builder
I think you are confusing the Pearson correlation coefficient (r) with the Coefficient of Determination (RSquare).
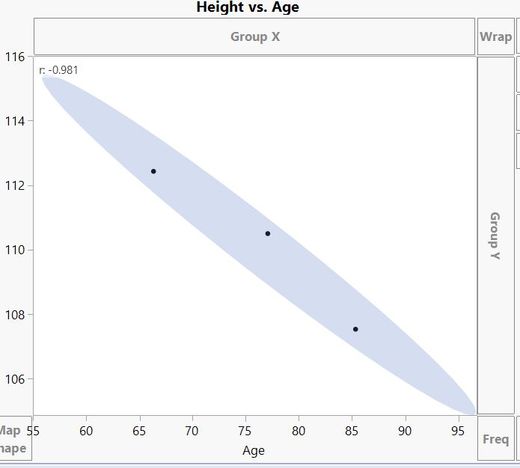
From Fit Y by X, Multivariate, AND Graph Builder, I get the same value for r, which is -0.981. I have included the Graph Builder report that shows this in the upper-left of the graph.
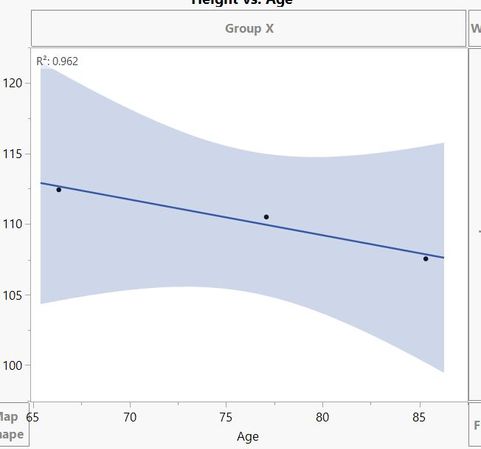
If I fit a linear regression line to the data I get an RSquare of 0.962 from both Graph Builder and Fit Y by X.
Graph Builder report for RSquare.
Recommended Articles
- © 2026 JMP Statistical Discovery LLC. All Rights Reserved.
- Terms of Use
- Privacy Statement
- Contact Us


