- Don’t miss your chance to experience Discovery Summit Europe at our best available rate! Early bird registration through 31 Oct.
- Graph Builder Toolbar streamlines interactive graphing. Creates shortcuts on Report and GraphBuilder Helpers toolbars. Download and install the extension.
- JMP will suspend normal business operations for our Rest and Recharge Day on Friday, October 2, 2026.
Regular business hours will resume on Monday, October 5, 2026.
- Subscribe to RSS Feed
- Mark Topic as New
- Mark Topic as Read
- Float this Topic for Current User
- Bookmark
- Subscribe
- Mute
- Printer Friendly Page
Discussions
Solve problems, and share tips and tricks with other JMP users.- User Community
- :
- Discussions
- :
- Multiple Comparison Intervals for Standard Deviation (Test for Equal Variance)

- Mark as New
- Bookmark
- Subscribe
- Mute
- Subscribe to RSS Feed
- Get Direct Link
- Report Inappropriate Content
Multiple Comparison Intervals for Standard Deviation (Test for Equal Variance)
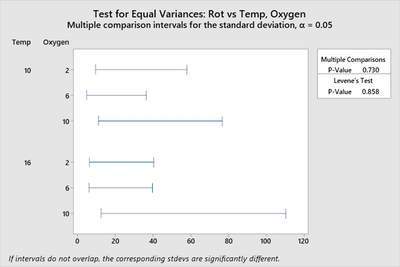
Attached is a sample from Minitab of Multiple comparison intervals for the standard deviation.
So, it is a crossed factor test for equal variance.
Does jmp have a similar function? Had been trying to do to Fit Y by X but it only separates it.
Accepted Solutions


- Mark as New
- Bookmark
- Subscribe
- Mute
- Subscribe to RSS Feed
- Get Direct Link
- Report Inappropriate Content
Re: Multiple Comparison Intervals for Standard Deviation (Test for Equal Variance)
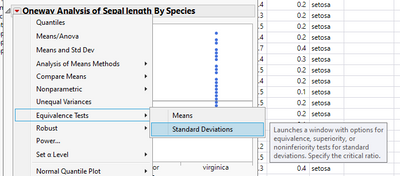
Hi @carlogarcia, I think a Oneway analysis from the Fit Y by X platform might have your answer. Launch Fit Y by X with a categorical column in the X and a continuous column in the Y. You might need to make a column that contains the string '10/2' for Temp = 10 and Oxygen = 2, and use that in the X. Then from the red triangle menu, select 'Unequal Variances'.
Depending on your goal an equivalence test might also help, These were improved in JMP 17:
https://www.jmp.com/support/help/en/17.1/index.shtml#page/jmp/equivalence-tests.shtml
- Mark as New
- Bookmark
- Subscribe
- Mute
- Subscribe to RSS Feed
- Get Direct Link
- Report Inappropriate Content
Re: Multiple Comparison Intervals for Standard Deviation (Test for Equal Variance)
Hi @carlogarcia, I think a Oneway analysis from the Fit Y by X platform might have your answer. Launch Fit Y by X with a categorical column in the X and a continuous column in the Y. You might need to make a column that contains the string '10/2' for Temp = 10 and Oxygen = 2, and use that in the X. Then from the red triangle menu, select 'Unequal Variances'.
Depending on your goal an equivalence test might also help, These were improved in JMP 17:
https://www.jmp.com/support/help/en/17.1/index.shtml#page/jmp/equivalence-tests.shtml
Recommended Articles
- © 2026 JMP Statistical Discovery LLC. All Rights Reserved.
- Terms of Use
- Privacy Statement
- Contact Us