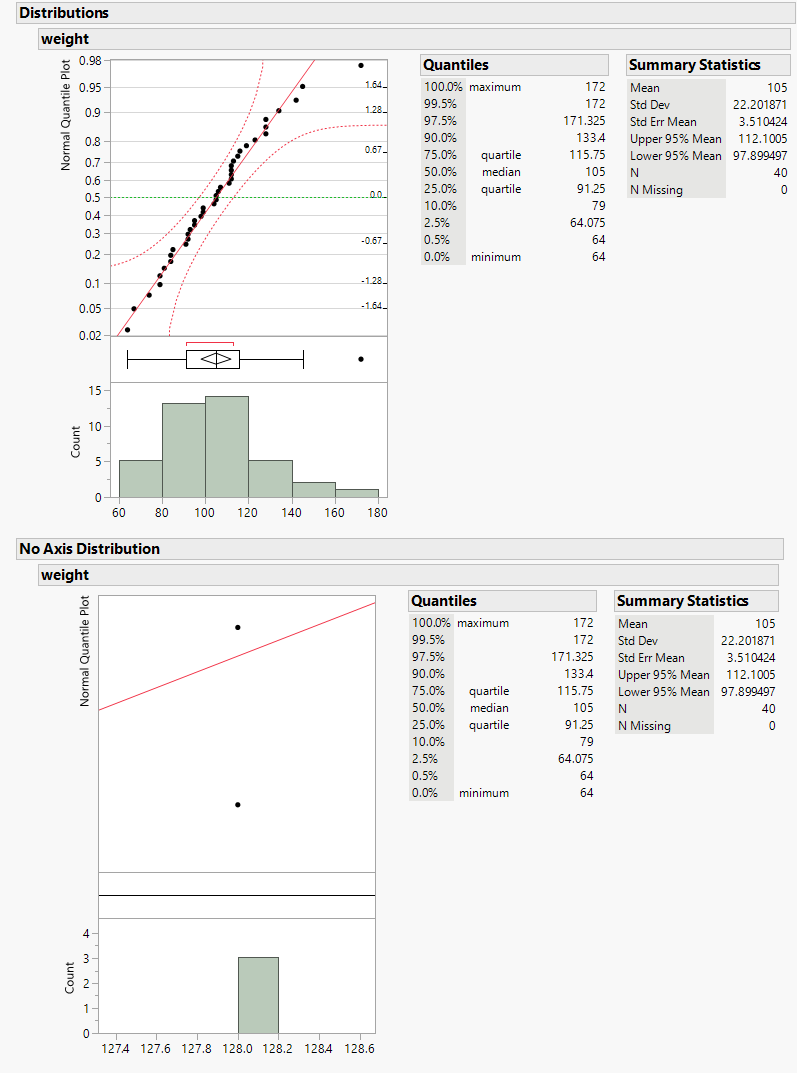
When I zoom into a Distribution Normal Quantile Plot, the y-axis will disappear. This makes it difficult to determine the exact quantile of a value. Is this a bug?
I am using JMP 19.1.0, Windows 11 Pro 25H2.
Names Default To Here( 1 );

dt = Open( "$SAMPLE_DATA/Big Class.jmp" );

// Normal vertical axis on Normal Quantile Plot.
dt << Distribution(
	Continuous Distribution(
		Column( :weight ),
		Horizontal Layout( 1 ),
		Vertical( 0 ),
		Count Axis( 1 ),
		Axes on Left( 1 ),
		Process Capability( 0 ),
		Normal Quantile Plot( 1 )
	)
);

// Vertical axis on Normal Quantile Plot is not displayed.
dt << Distribution(
	Continuous Distribution(
		Column( :weight ),
		Horizontal Layout( 1 ),
		Vertical( 0 ),
		Count Axis( 1 ),
		Axes on Left( 1 ),
		Process Capability( 0 ),
		Normal Quantile Plot( 1 )
	),
	SendToReport(
		Dispatch( {}, "Distributions", OutlineBox, {Set Title( "No Axis Distribution" )} ),
		Dispatch( {"weight"}, "1", ScaleBox, {Format( "Fixed Dec", 12, 1 ), Min( 127.313361687689 ), Max( 128.674638157731 ), Inc( 0.2 )} ),
		Dispatch( {"weight"}, "5", ScaleBox, {Min( 0.819361880370155 ), Max( 0.857836194033201 )} )
	)
);