- Don’t miss your chance to experience Discovery Summit Europe at our best available rate! Early bird registration through 31 Oct.
- Graph Builder Toolbar streamlines interactive graphing. Creates shortcuts on Report and GraphBuilder Helpers toolbars. Download and install the extension.
- Subscribe to RSS Feed
- Mark Topic as New
- Mark Topic as Read
- Float this Topic for Current User
- Bookmark
- Subscribe
- Mute
- Printer Friendly Page
Discussions
Solve problems, and share tips and tricks with other JMP users.- User Community
- :
- Discussions
- :
- Re: Mean from several columns in ANOVA

- Mark as New
- Bookmark
- Subscribe
- Mute
- Subscribe to RSS Feed
- Get Direct Link
- Report Inappropriate Content
Mean from several columns in ANOVA
Is there a way to perform an ANOVA analysis where the mean of each column is represented? For example, I have 4 different columns with answers from 1-7. I want to represent these answers using only one model. If i use "distribution" i get 4 different models, and I only want one. Anyone?
Accepted Solutions


- Mark as New
- Bookmark
- Subscribe
- Mute
- Subscribe to RSS Feed
- Get Direct Link
- Report Inappropriate Content
Re: Mean from several columns in ANOVA
To expand on @Dan_Obermiller , if you have a data table
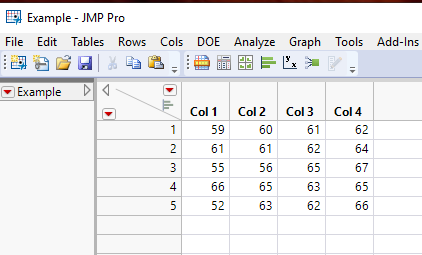
You can move the data into the form required for the Anova analysis by using
Tables==>Split
Fill the dialog box out as shown below
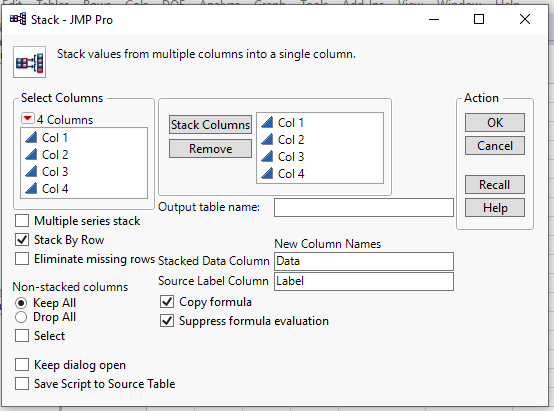
Click OK, and you will get a data table like this
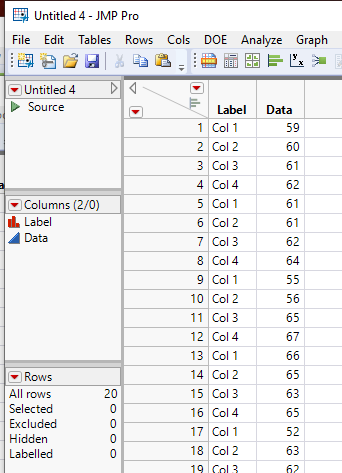
Now go to
Analyze==>Fit Y by X
and fill out the dialog box as:
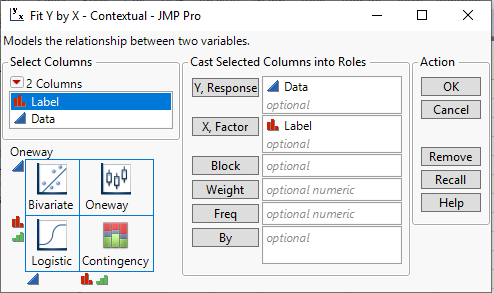
Click OK and the platform will generate
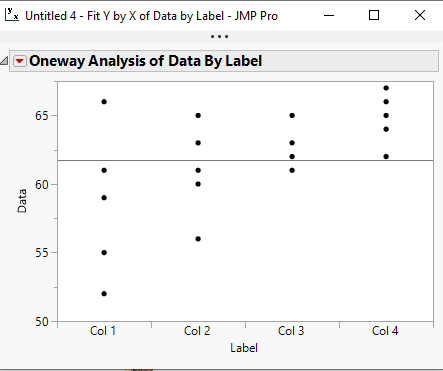
Now go to the red triangle and select "Means Anova" and you will get
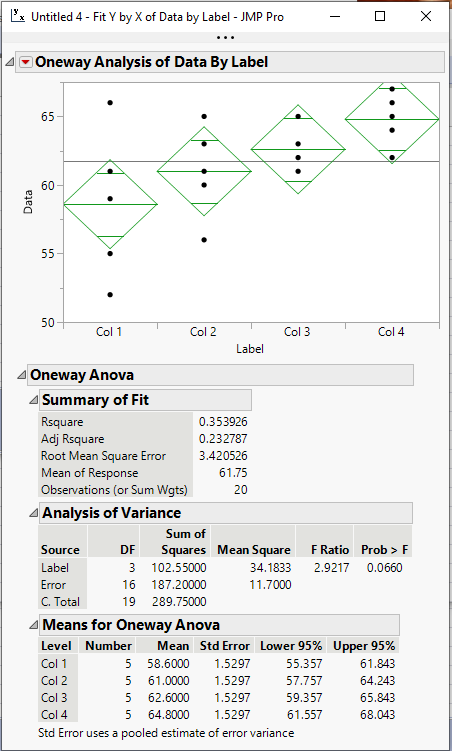
Your Analysis of Variance analysis


- Mark as New
- Bookmark
- Subscribe
- Mute
- Subscribe to RSS Feed
- Get Direct Link
- Report Inappropriate Content
Re: Mean from several columns in ANOVA
Not exactly sure what you are looking for. ANOVA is a method to compare several groups of data to each other. For example, you have four groups so have your data structured similar to this:
Group Data
A 7
A 9
B 3
B 5
...
then you use Fit Y by X. The group column is the X. The Data column is the Y.
You should start by going to the Help menu and choosing Tutorials > Many Means Tutorial.
- Mark as New
- Bookmark
- Subscribe
- Mute
- Subscribe to RSS Feed
- Get Direct Link
- Report Inappropriate Content
Re: Mean from several columns in ANOVA
To expand on @Dan_Obermiller , if you have a data table
You can move the data into the form required for the Anova analysis by using
Tables==>Split
Fill the dialog box out as shown below
Click OK, and you will get a data table like this
Now go to
Analyze==>Fit Y by X
and fill out the dialog box as:
Click OK and the platform will generate
Now go to the red triangle and select "Means Anova" and you will get
Your Analysis of Variance analysis
- Mark as New
- Bookmark
- Subscribe
- Mute
- Subscribe to RSS Feed
- Get Direct Link
- Report Inappropriate Content
Re: Mean from several columns in ANOVA


- Mark as New
- Bookmark
- Subscribe
- Mute
- Subscribe to RSS Feed
- Get Direct Link
- Report Inappropriate Content
Re: Mean from several columns in ANOVA
@txnelson you're a data munging genius. Nice solution and post too.
Recommended Articles
- © 2026 JMP Statistical Discovery LLC. All Rights Reserved.
- Terms of Use
- Privacy Statement
- Contact Us