- Learn how to build custom Python data connectors and further customize JMP’s Data Connector Framework with the Python Data Connector Demo, available now in the JMP Marketplace!
- See how to create experiments to support product design and ID useful product features. Register for June 12 webinar, 2pm US Eastern Time.
- Subscribe to RSS Feed
- Mark Topic as New
- Mark Topic as Read
- Float this Topic for Current User
- Bookmark
- Subscribe
- Mute
- Printer Friendly Page
Discussions
Solve problems, and share tips and tricks with other JMP users.- JMP User Community
- :
- Discussions
- :
- Re: Marker

- Mark as New
- Bookmark
- Subscribe
- Mute
- Subscribe to RSS Feed
- Get Direct Link
- Report Inappropriate Content
Marker
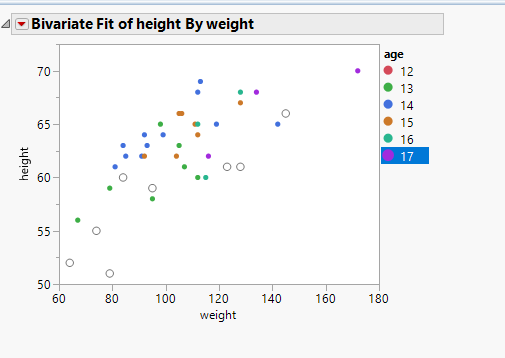
How to set the legend in age=14 to a circle with no fill thru scripting?
Accepted Solutions

- Mark as New
- Bookmark
- Subscribe
- Mute
- Subscribe to RSS Feed
- Get Direct Link
- Report Inappropriate Content
Re: Marker
Use a script like this to set the marker you prefer for your desired rows:
Names Default To Here( 1 );
dt = Open( "$SAMPLE_DATA/Big Class.jmp" );
rows = dt << Select Where( :Age == 14 );
rows << Markers( 8 );
Then when you make any visuals, those markers will be applied. Or if you prefer not to do through scripting you can do this:
1. Right click on the value in your data table you wish to set markers for
2. Select Matching Cells
3. From Row menu choose Markers and pick your marker from there

- Mark as New
- Bookmark
- Subscribe
- Mute
- Subscribe to RSS Feed
- Get Direct Link
- Report Inappropriate Content
Re: Marker
If you click the red triangle and select save script you will see the necessary JSL commands to change the marker. Here's an example:
dt = open("$sample_data/Car Physical Data.jmp");

dt << Graph Builder(
	Show Control Panel( 0 ),
	Variables( X( :Displacement ), Y( :Weight ), Overlay( :Country ) ),
	Elements( Points( X, Y, Legend( 3 ) ) ),
	SendToReport(
		Dispatch(
			{},
			"400",
			ScaleBox,
			{Legend Model(
				3,
				Properties( 2, {Marker( "Circle" )}, Item ID( "USA", 1 ) )
			)}
		)
	)
);- Mark as New
- Bookmark
- Subscribe
- Mute
- Subscribe to RSS Feed
- Get Direct Link
- Report Inappropriate Content
Re: Marker
Use a script like this to set the marker you prefer for your desired rows:
Names Default To Here( 1 );
dt = Open( "$SAMPLE_DATA/Big Class.jmp" );
rows = dt << Select Where( :Age == 14 );
rows << Markers( 8 );
Then when you make any visuals, those markers will be applied. Or if you prefer not to do through scripting you can do this:
1. Right click on the value in your data table you wish to set markers for
2. Select Matching Cells
3. From Row menu choose Markers and pick your marker from there
- Mark as New
- Bookmark
- Subscribe
- Mute
- Subscribe to RSS Feed
- Get Direct Link
- Report Inappropriate Content
Re: Marker
- Mark as New
- Bookmark
- Subscribe
- Mute
- Subscribe to RSS Feed
- Get Direct Link
- Report Inappropriate Content
Re: Marker
Here is what i meant
Bivariate(
	Y( :height ),
	X( :weight ),
	SendToReport(
		Dispatch(
			{},
			"Bivar Plot",
			FrameBox,
			{Row Legend(
				age,
				Color( 1 ),
				Color Theme( "JMP Default" ),
				Marker( 0 ),
				Marker Theme( "" ),
				Continuous Scale( 0 ),
				Reverse Scale( 0 ),
				Excluded Rows( 0 )
			)}
		)
	)
);

ab = Data Table( "Big Class" );
ab << Select Where( :Age == 12 ) << Colors( 1 ) << Markers( 8 ) << clear select;
The row legend where age=12 did not change however the markers on the plot did.

- Mark as New
- Bookmark
- Subscribe
- Mute
- Subscribe to RSS Feed
- Get Direct Link
- Report Inappropriate Content
Re: Marker
You can set individual markers manually by double-clicking on the legend. In the popup window right click on the marker of interest and select Marker > (click on desired marker here).
- Mark as New
- Bookmark
- Subscribe
- Mute
- Subscribe to RSS Feed
- Get Direct Link
- Report Inappropriate Content
Re: Marker
- Mark as New
- Bookmark
- Subscribe
- Mute
- Subscribe to RSS Feed
- Get Direct Link
- Report Inappropriate Content
Re: Marker
If you click the red triangle and select save script you will see the necessary JSL commands to change the marker. Here's an example:
dt = open("$sample_data/Car Physical Data.jmp");

dt << Graph Builder(
	Show Control Panel( 0 ),
	Variables( X( :Displacement ), Y( :Weight ), Overlay( :Country ) ),
	Elements( Points( X, Y, Legend( 3 ) ) ),
	SendToReport(
		Dispatch(
			{},
			"400",
			ScaleBox,
			{Legend Model(
				3,
				Properties( 2, {Marker( "Circle" )}, Item ID( "USA", 1 ) )
			)}
		)
	)
);- Mark as New
- Bookmark
- Subscribe
- Mute
- Subscribe to RSS Feed
- Get Direct Link
- Report Inappropriate Content
Re: Marker
Recommended Articles
- © 2026 JMP Statistical Discovery LLC. All Rights Reserved.
- Terms of Use
- Privacy Statement
- Contact Us