- We’re retiring the File Exchange at the end of this year. The JMP Marketplace is now your destination for add-ins and extensions.
- JMP 19 is here! Learn more about the new features.
- Subscribe to RSS Feed
- Mark Topic as New
- Mark Topic as Read
- Float this Topic for Current User
- Bookmark
- Subscribe
- Mute
- Printer Friendly Page
Discussions
Solve problems, and share tips and tricks with other JMP users.- JMP User Community
- :
- Discussions
- :
- Re: MANOVA Partial Covariance Matrix
- Mark as New
- Bookmark
- Subscribe
- Mute
- Subscribe to RSS Feed
- Get Direct Link
- Report Inappropriate Content
MANOVA Partial Covariance Matrix
Hello,
I am getting familiar with JMP's Fit Model platform by trying to match results with MATLAB and MS Excel long-hand that I have computed.
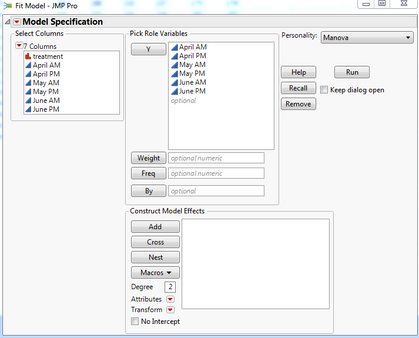
Using the "Cholesterol.jmp" sample data file and running the Fit Model platform with MANOVA personality, I was a bit confused as to why my Partial Covariance matrix did not identically match my Covariance Matrices in MATLAB and MS Excel.
Here is the JMP output:
Here is calculating the Covariance Matrix in MS Excel:
Cov(x,y) = (1/(N-1))*sum((Xi-Xbar)*(Yi-Ybar))
N = 20 (patients)
Here is the same output as MS Excel in MATLAB using the cov(x, y) function:
Maybe I am not understanding what the partial covariance matrix is, but shouldn't it be identical to the covariance matrix?
Thank you.
- Mark as New
- Bookmark
- Subscribe
- Mute
- Subscribe to RSS Feed
- Get Direct Link
- Report Inappropriate Content
Re: MANOVA Partial Covariance Matrix
Hi, bio_grad!
First, a quick lesson on partial covariance matrices:
A classic example is the observed positive correlation between the damage caused by a fire and the number of fire trucks sent to the fire. It's obvious to almost everyone that it would be crazy to try to lessen a fire's damage by sending fewer fire trucks to them...there is a third variable, maybe "size of the fire", that also influences the damage. If one were to hold the size of the fire constant, one might even see a negative correlation between the damage and number of fire trucks. This is what Partial Correlation and Covariance are trying to do by using residuals from the estimated model. Covariance and partial covariance are not the same conceptually, and will only rarely and trivially give identical results. I recommend Everitt, B.S., Dunn. G. (2001) Applied Multivariate Data Analysis (2nd Ed.) Oxford University Press for a more complete treatment, if you're interested. Even Sir Ronald Aylmer Fisher has written on partial correlation!
Second, friends don't let friends use Excel for statistics or even mathematics. The road to hell is paved with software results comparisons irrespective of the packages, but Excel is repeatedly documented as doing statistics and math incorrectly. Beware any results from Excel, even though it does appear to match MATLAB in this instance. MATLAB has great matrix algebra chops, but it looks to me like you just did covariance in it, and not partial covariance. True?
- Mark as New
- Bookmark
- Subscribe
- Mute
- Subscribe to RSS Feed
- Get Direct Link
- Report Inappropriate Content
Re: MANOVA Partial Covariance Matrix
Hi Kevin,
Thanks for the reply and sharing the text resource.
The MS Excel matrix that I posted was hand-made by myself without any add-ins, using the covariance equation I listed. I used the unbiased MATLAB cov function to verify they had the same result.
I understand the concept of partial correlation when it involves three variables, but in the case of the Cholesterol.jmp file, there are six variables (columns) of data.
Googling partial correlation has a fair amount of hits but I can't seem to find any solid information on partial covariance and its mathematical relationship to partical correlation.
The covariance matrices that I calculated in MATLAB and MS Excel are very similar to the JMP partial covariance matrix with a slight adjustment. I realize covariance and partial covariance are not the same, but they are mathematically related somehow.
I would like to determine the equations behind how JMP is generating that partial covariance matrix, given that there are six variables of data.
- Mark as New
- Bookmark
- Subscribe
- Mute
- Subscribe to RSS Feed
- Get Direct Link
- Report Inappropriate Content
Re: MANOVA Partial Covariance Matrix
I feel like I am getting one step closer to figuring out how JMP is calculating this partial covariance matrix, but still can't quite nail it down.
I found a good resource that describes the method with a simple example, but I can't match the JMP results for the Cholesterol.jmp with six variables using this techique.
Cause and Correlation in Biology - A User's Guide to Path Analysis By Bill Shipley
Attached PDF.
Anyone lend a hand?
Thanks!
Recommended Articles
- © 2025 JMP Statistical Discovery LLC. All Rights Reserved.
- Terms of Use
- Privacy Statement
- Contact Us


