- Subscribe to RSS Feed
- Mark Topic as New
- Mark Topic as Read
- Float this Topic for Current User
- Bookmark
- Subscribe
- Mute
- Printer Friendly Page
Discussions
Solve problems, and share tips and tricks with other JMP users.- JMP User Community
- :
- Discussions
- :
- Lot Geneaology
- Mark as New
- Bookmark
- Subscribe
- Mute
- Subscribe to RSS Feed
- Get Direct Link
- Report Inappropriate Content
Lot Geneaology
Anyone have tips for organizing lot genealogy in JMP? For example, DP batches that contain many (different types and lots) of excipients. And the excipients have COA values that we want to track.
I'm assuming just multiple row entries for a DP lot on the left, working to more granular information in columns to the right. Is this the best way to track and visualize?
- Mark as New
- Bookmark
- Subscribe
- Mute
- Subscribe to RSS Feed
- Get Direct Link
- Report Inappropriate Content
Re: Lot Geneaology
The 'best' way to track and visualize depends on lots of factors and information. My suggestion is work your way backwards from the consumers of the information. Ask these questions:
1. What do they need to know or decide?
2. What is their sophistication/maturity level wrt to understanding data visualization output and or statistical methods?
3. What capabilities in JMP provide the answers to question 1 in the context of question 2.
4. What do the producers need to know or do wrt to data collection and information production using JMP?
From there the structure of your JMP data table will become apparent as you develop the specific visualizations and analysis workflows.
- Mark as New
- Bookmark
- Subscribe
- Mute
- Subscribe to RSS Feed
- Get Direct Link
- Report Inappropriate Content
Re: Lot Geneaology
@Kristen_C That's a handy way to have the data formatted in one big table.
When the data is in that hierarcheal format, it makes it easy to build drill down visualizations in graph builder.
Sometimes the big flat file gets kind of big, like millions of rows, with lots of repetition at the higher levels. In this case, using the column utility to compress columns helps. Its a little more complex to set up, but virtual joins can help too.
- Mark as New
- Bookmark
- Subscribe
- Mute
- Subscribe to RSS Feed
- Get Direct Link
- Report Inappropriate Content
Re: Lot Geneaology
The only thing I'll add to my former colleague's @Byron_JMP recommendation is if visualization of the data wrt to chronological order is important for things like run charts, control charts, time series plots, etc. then respecting time ordering becomes paramount and you'll have to perhaps adjust the other columns to defer to the time ordering sequence.
- Mark as New
- Bookmark
- Subscribe
- Mute
- Subscribe to RSS Feed
- Get Direct Link
- Report Inappropriate Content
Re: Lot Geneaology
Thanks @Byron_JMP , follow up question here. I built out a data table. I have a column do DP lots and DS lots. If one drug product lot, has more than one DS, how do you recommend tracking that? Originally I made DS lot 1, DS lot 2, etc and just left the extra columns blank when only 1 DS lot existed. But then visualizing the data doesn't work well. Feels like a simple solution I'm over looking.
| DP Lot | DS Lot | Test Value |
| 1 | 1, 2 | 10 |
| 2 | 2 | 50 |
| 3 | 1, 2, 3 | 10 |
- Mark as New
- Bookmark
- Subscribe
- Mute
- Subscribe to RSS Feed
- Get Direct Link
- Report Inappropriate Content
Re: Lot Geneaology
There might be some better way to track multiple components that are added are combined than what I'm going to suggest.
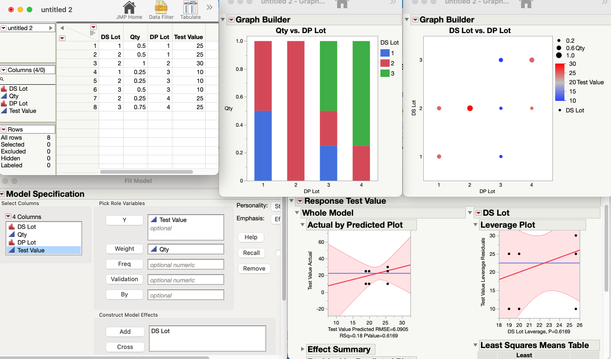
In this case multiple DS lots are added to formulate a DP lot. Often we know more information about the DS Lot, like maybe (hopefully) it's "test value", and how much was added to the DP lot.
What I might want to visualize is how much of each DS lot went into each DP lot. I might also want to model the expected vs. actual "test values" for the DP lots. (sometimes the DS and DP lots are tested at times very far apart, and test method performance drift results in DP lots with much higher or lower "test values" than expected.
For simplicity, I would likely keep a separate table for each of the DS and DP lots, and this intermediate table for keeping track of what components go into each DP. When I need to, then I can use virtual joins to combine the data.
This is a hard problem to work with. If anyone else has a better data structure, I'd certainly like to hear about it.
Recommended Articles
- © 2026 JMP Statistical Discovery LLC. All Rights Reserved.
- Terms of Use
- Privacy Statement
- Contact Us


