- Instantly extract effect sizes, F-ratios, and FDR-adjusted p-values from your models with the Calculate Effects Sizes extension, available now in the JMP Marketplace!
- New to JMP? Join us Sept. 23-24 for the Early User Edition of Discovery Summit, tailor-made for new users. Register now for free!
- See how to use the JMP Marketplace – Free tools to expand JMP capabilities. Register. July 10, 2 pm US Eastern Time.
- Subscribe to RSS Feed
- Mark Topic as New
- Mark Topic as Read
- Float this Topic for Current User
- Bookmark
- Subscribe
- Mute
- Printer Friendly Page
Discussions
Solve problems, and share tips and tricks with other JMP users.- JMP User Community
- :
- Discussions
- :
- Logistic regression and repeated measures

- Mark as New
- Bookmark
- Subscribe
- Mute
- Subscribe to RSS Feed
- Get Direct Link
- Report Inappropriate Content
Logistic regression and repeated measures
Hi, I am having problems trying to find the proper way to analyze a set of data and would greatly appreciate some help.
My data is about learning. It includes the response of an individual to two different stimuli (one rewarded, the other unrewarded) presented sequentially. I also have different pairs of stimuli. What I am interested in is to determine the effect of rewarding a stimulus, the effect of using different pairs of stimuli and how the probability changes overtime. I would like to be able to have logistic regressions for each treatment (pair of stimuli), to compare treatments and but at the same time be able to control for the fact that I am measuring the same individuals repeatedly. I know how to fit logistic regressions and how to make repeated measures analyses, but some how think that I need to have them together. Any ideas? I greatly appreciate any help!!
Andre
Accepted Solutions

- Mark as New
- Bookmark
- Subscribe
- Mute
- Subscribe to RSS Feed
- Get Direct Link
- Report Inappropriate Content
Re: Logistic regression and repeated measures
Under Analyze, select "Modeling" then "Categorical". You can use "Repeated measures" if one row=one subject. If one subject is recorded across several rows, then you can use "multiple response by ID". Your treatments are the X grouping categories.
- Mark as New
- Bookmark
- Subscribe
- Mute
- Subscribe to RSS Feed
- Get Direct Link
- Report Inappropriate Content
Re: Logistic regression and repeated measures
What is the response you are measuring? Is it binomial, like your treatments?
- Mark as New
- Bookmark
- Subscribe
- Mute
- Subscribe to RSS Feed
- Get Direct Link
- Report Inappropriate Content
Re: Logistic regression and repeated measures
Hi mfisher,
Yes, it is binomial. I simply record whether the individual responds or not every time I present a stimulus.
Thanks for any help!
Andre
- Mark as New
- Bookmark
- Subscribe
- Mute
- Subscribe to RSS Feed
- Get Direct Link
- Report Inappropriate Content
Re: Logistic regression and repeated measures
Under Analyze, select "Modeling" then "Categorical". You can use "Repeated measures" if one row=one subject. If one subject is recorded across several rows, then you can use "multiple response by ID". Your treatments are the X grouping categories.
- Mark as New
- Bookmark
- Subscribe
- Mute
- Subscribe to RSS Feed
- Get Direct Link
- Report Inappropriate Content
Re: Logistic regression and repeated measures
Excellent! Thanks very much. I had never explored this tool of jmp before and seems to be very helpful not only for this but for other analyses. And a last question if you don't mind. Is it appropriate to pair the stats that I find using the Categorical analysis with graphs of log regressions like the ones found using X by Y plots?
Thanks so much again!
Andre J.
- Mark as New
- Bookmark
- Subscribe
- Mute
- Subscribe to RSS Feed
- Get Direct Link
- Report Inappropriate Content
Re: Logistic regression and repeated measures
I believe it is appropriate to display the relationships of your data with X by Y plots, but to use the stats from the repeated measures analysis. Any stats from the X by Y plots would not account for the repeated measures design and would be inaccurate, especially the variance and p-values.

- Mark as New
- Bookmark
- Subscribe
- Mute
- Subscribe to RSS Feed
- Get Direct Link
- Report Inappropriate Content
Re: Logistic regression and repeated measures
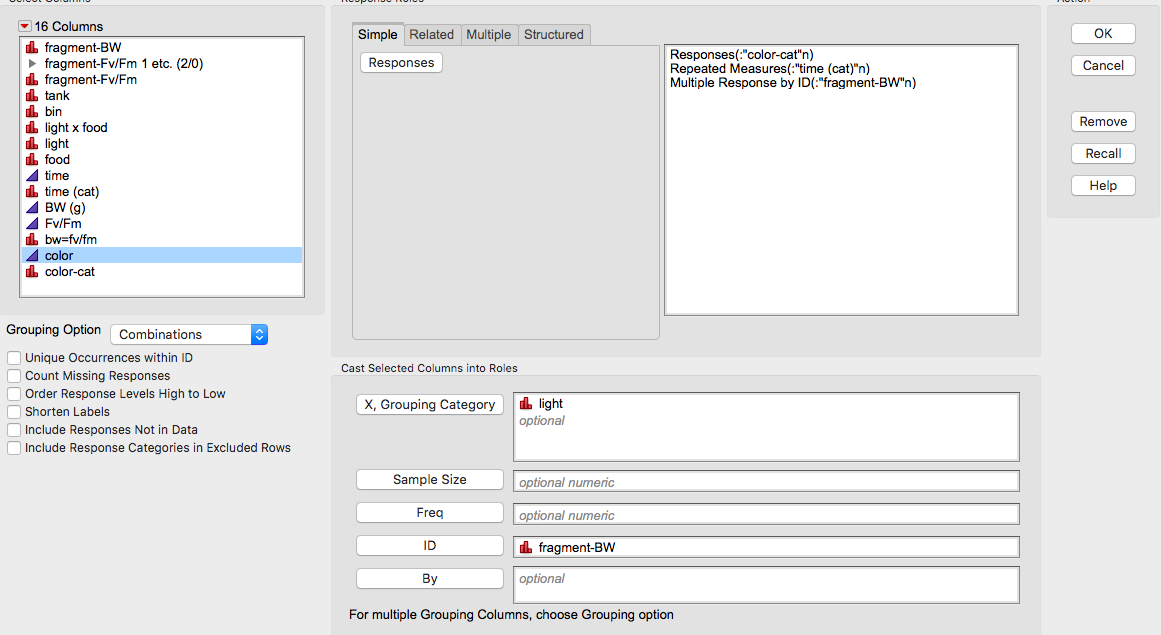
I was just looking around for how to do this and glad I stumbled upon this post. This is a JMP platform I had no idea existed! But I have a question. I basically need to do a repeated measures ANOVA with categorical data, as well. The responses are essentially scores that range from 2-6. I probably could use a more typical approach since they ARE integers, but they are constrained between 1 and 6, so I would need to use a different distribution, and I don't know if the mixed model platform can handle data that have strange distributions (i.e., something that combines the perks of GLM with those of mixed models). In this case, individual subjects were scored repeatedly over time, so I used the "multiple response by ID" for my sample ID, "color" for my score (i.e., the Y), and "time" as the repeated measure. I want to see how light influences the scores, so "light" is the X. I get lots of nice displays of hows vary by subject in response to light, but I don't get any test statistics. I looked under the red triangle and saw some tests, but they don't seem to be looking at overall treatment effects, but instead within-subject effects. Can this Consumer-categorical response give you treatment effect data (i.e., p-values that show me the light effects in this case)? Now, to be honest, I could probably just calculate the difference between the final score and the initial one and use a more traditional approach, but I am curious as to whether you CAN use this Consumer platform to get quantitative treatment effect data. When you click "show letters," is that showing you differences between the individual means?
Recommended Articles
- © 2026 JMP Statistical Discovery LLC. All Rights Reserved.
- Terms of Use
- Privacy Statement
- Contact Us