- Subscribe to RSS Feed
- Mark Topic as New
- Mark Topic as Read
- Float this Topic for Current User
- Bookmark
- Subscribe
- Mute
- Printer Friendly Page
Discussions
Solve problems, and share tips and tricks with other JMP users.- JMP User Community
- :
- Discussions
- :
- Re: Local Data filter & Animation - how to specify the range?
- Mark as New
- Bookmark
- Subscribe
- Mute
- Subscribe to RSS Feed
- Get Direct Link
- Report Inappropriate Content
Local Data filter & Animation - how to specify the range?
The Animation Menu of the local Data Filter is a very convenient way to produce a gif image for a time series.
Unfortunately, when I click on play, the selected range changes before the animation starts :(
Is there an option to specify the width of the selected values?
Accepted Solutions
- Mark as New
- Bookmark
- Subscribe
- Mute
- Subscribe to RSS Feed
- Get Direct Link
- Report Inappropriate Content
Re: Local Data filter & Animation - how to specify the range?
The min/max delta for animation is set once animation begins on a continuous column. It does not reset after pausing the animation, but it does reset if you fully stop the animation and then restart it.
- Mark as New
- Bookmark
- Subscribe
- Mute
- Subscribe to RSS Feed
- Get Direct Link
- Report Inappropriate Content
Re: Local Data filter & Animation - how to specify the range?
Hi,
Have you tried to adjust the size of the interval by selecting the context menu (downward red triangle) and defining the number of bins?
Best,
TS
- Mark as New
- Bookmark
- Subscribe
- Mute
- Subscribe to RSS Feed
- Get Direct Link
- Report Inappropriate Content
Re: Local Data filter & Animation - how to specify the range?
On my system (Jmp 17.1) this changes the width of the (grey) bins, but not the stepwidth (width of the blue region).
- Mark as New
- Bookmark
- Subscribe
- Mute
- Subscribe to RSS Feed
- Get Direct Link
- Report Inappropriate Content
Re: Local Data filter & Animation - how to specify the range?
After resizing bins, "re-size" the range once (it should start auto-scaling). That seems to work for me in JMP16.
Names Default To Here(1);
dt = Open("$SAMPLE_DATA/Big Class.jmp");

gb = dt << Graph Builder(
	Variables(X(:name), Y(:height)),
	Elements(Points(X, Y, Legend(295))),
	Local Data Filter(
		Show Modes(1),
		Add Filter(
			columns(:weight),
			Where(:weight >= 93.12 & :weight <= 115.88),
			Display(:weight, NBins(5))
		),
		Animation(Animate Column(:weight))
	)
);
Maybe some sort of "Lock Range" or similar could be useful feature when using animations? Or maybe even in general for filters.
Other option could be to create Nominal/ordinal column and use that for the local data filter.
- Mark as New
- Bookmark
- Subscribe
- Mute
- Subscribe to RSS Feed
- Get Direct Link
- Report Inappropriate Content
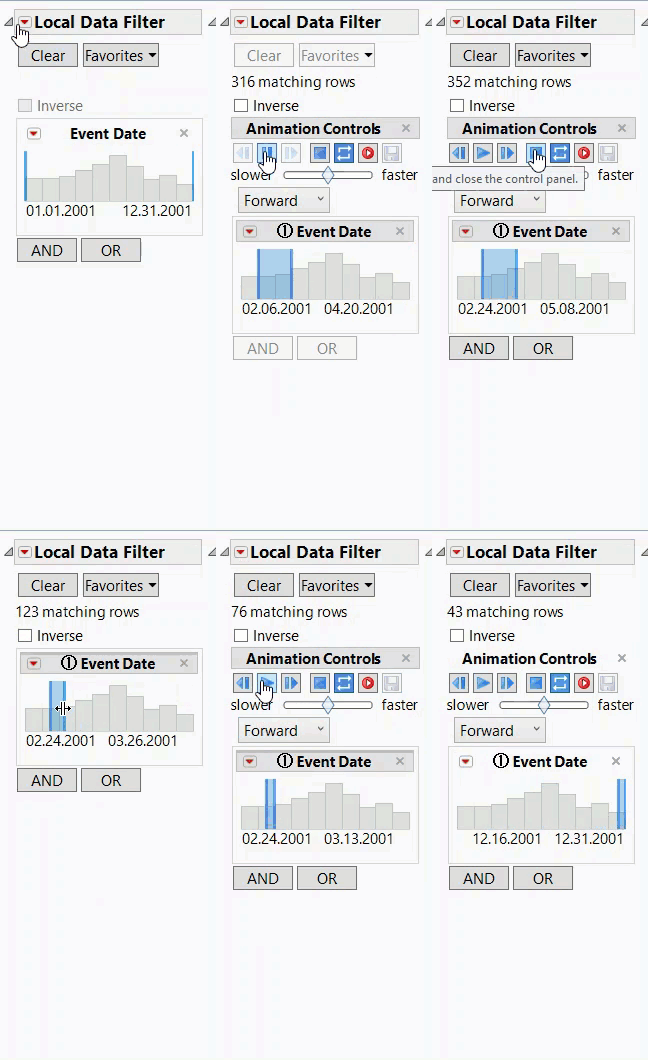
Re: Local Data filter & Animation - how to specify the range?
This is how it looks on my system - Jmp 17.1 & 16.2, Win 10.
Hard to find out what influences the step width - but it's quite independent of the bin width setting.
Often, the step width of the animation fits to N=5 (independent of N), sometimes it's smaller (even for N=5).
Just an issue on my system?
- Mark as New
- Bookmark
- Subscribe
- Mute
- Subscribe to RSS Feed
- Get Direct Link
- Report Inappropriate Content
Re: Local Data filter & Animation - how to specify the range?
The min/max delta for animation is set once animation begins on a continuous column. It does not reset after pausing the animation, but it does reset if you fully stop the animation and then restart it.
- Mark as New
- Bookmark
- Subscribe
- Mute
- Subscribe to RSS Feed
- Get Direct Link
- Report Inappropriate Content
Re: Local Data filter & Animation - how to specify the range?
@danschikore , thanks a lot :)
the it is:
- the user has to specify the step width before he
opens the animation menu. presses play (edit after the last comment) - after pressing play, changes don't have an effect on the step width -- as long as the animation menu is opened
- to change the step width after pressing play, one has to close the animation menu and re-open it:
- Mark as New
- Bookmark
- Subscribe
- Mute
- Subscribe to RSS Feed
- Get Direct Link
- Report Inappropriate Content
Re: Local Data filter & Animation - how to specify the range?
Hi @hogi - the step width is actually fixed at the point that you press "play" rather than when the animation panel is opened. I am not sure why it does not allow the step to be reset when paused, but that is something we can consider for the future.
- Mark as New
- Bookmark
- Subscribe
- Mute
- Subscribe to RSS Feed
- Get Direct Link
- Report Inappropriate Content
Re: Local Data filter & Animation - how to specify the range?
An update to this thread - the data filter animation has been improved here in JMP 18, to allow the range for continuous filters to be reset when the animation is paused.
- Mark as New
- Bookmark
- Subscribe
- Mute
- Subscribe to RSS Feed
- Get Direct Link
- Report Inappropriate Content
Re: Local Data filter & Animation - how to specify the range?
Is there an animation mode where just the "end" of the filter is moved to the right?
To show trends over time - by keeping the "historic" data visible?
Recommended Articles
- © 2026 JMP Statistical Discovery LLC. All Rights Reserved.
- Terms of Use
- Privacy Statement
- Contact Us


