- Don’t miss your chance to experience Discovery Summit Europe at our best available rate! Early bird registration through 31 Oct.
- Graph Builder Toolbar streamlines interactive graphing. Creates shortcuts on Report and GraphBuilder Helpers toolbars. Download and install the extension.
- Subscribe to RSS Feed
- Mark Topic as New
- Mark Topic as Read
- Float this Topic for Current User
- Bookmark
- Subscribe
- Mute
- Printer Friendly Page
Discussions
Solve problems, and share tips and tricks with other JMP users.- User Community
- :
- Discussions
- :
- Re: Linear Regression Interpreting output

- Mark as New
- Bookmark
- Subscribe
- Mute
- Subscribe to RSS Feed
- Get Direct Link
- Report Inappropriate Content
Linear Regression Interpreting output
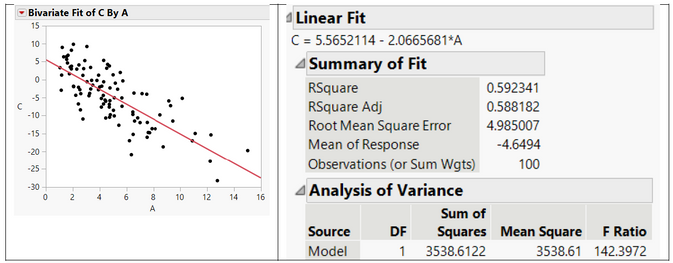
I have this output and I want to know what is the expected A value when C equals 0.
Don't I just set 0 in the linear equation and get A=2.6? (I've told that the answer is 3.6..)
In addition, does anyone know what is the meaning of: "Calculate the value of the TOTAL"?
Thank you everyone!
Accepted Solutions


- Mark as New
- Bookmark
- Subscribe
- Mute
- Subscribe to RSS Feed
- Get Direct Link
- Report Inappropriate Content
Re: Linear Regression Interpreting output
Setting A=0 will result in giving you the intercept value, which in your example is 5.5652114
- Mark as New
- Bookmark
- Subscribe
- Mute
- Subscribe to RSS Feed
- Get Direct Link
- Report Inappropriate Content
Re: Linear Regression Interpreting output
Setting A=0 will result in giving you the intercept value, which in your example is 5.5652114
- Mark as New
- Bookmark
- Subscribe
- Mute
- Subscribe to RSS Feed
- Get Direct Link
- Report Inappropriate Content
Re: Linear Regression Interpreting output
Right, so if C=0, A will be 2.6.
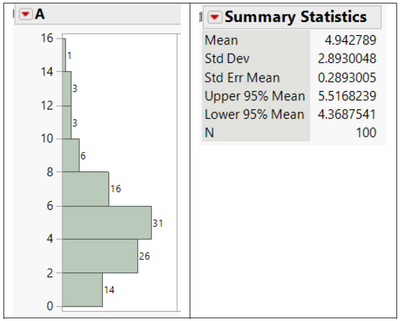
And I don't need to relate to the first image? (again..only because I was told that the answer is A=3.6)
- Mark as New
- Bookmark
- Subscribe
- Mute
- Subscribe to RSS Feed
- Get Direct Link
- Report Inappropriate Content
Re: Linear Regression Interpreting output
I come up with 2.69

- Mark as New
- Bookmark
- Subscribe
- Mute
- Subscribe to RSS Feed
- Get Direct Link
- Report Inappropriate Content
Re: Linear Regression Interpreting output
The first image in your post (the histogram) can't be used to determine the value of A when C = 0. You can determine the value of A when C = 0 by solving the regression equation in second image by substituting 0 for C and then algebraically solving the equation 0 = 5.565 - 2.067*A. Or do it the cool way...use the JMP cross hair tool from the tool bar and find the value of A when you put the cross hairs over the red line when C = 0. Either way the answer is 2.69.


- Mark as New
- Bookmark
- Subscribe
- Mute
- Subscribe to RSS Feed
- Get Direct Link
- Report Inappropriate Content
Re: Linear Regression Interpreting output
Or another cool way: Use Fit Model instead of Fit Y by X. then you can use Inverse Prediction. You don't need to do any calculation or guessing with the crosshairs. Plus, you will even get a 95% confidence interval for the possible A value.
- Mark as New
- Bookmark
- Subscribe
- Mute
- Subscribe to RSS Feed
- Get Direct Link
- Report Inappropriate Content
Re: Linear Regression Interpreting output
That's one of the cool things about JMP...very often there are multiple ways to visualize, interpret, and gain insight wrt to data and a problem at hand. One thing I always coached my JMP user friends is "Try them all!" You might find something unique you weren't even looking for! Then the real fun begins:)

- Mark as New
- Bookmark
- Subscribe
- Mute
- Subscribe to RSS Feed
- Get Direct Link
- Report Inappropriate Content
Re: Linear Regression Interpreting output
I don't get 3.6 either. But your bivariate plot does not look linear to me - I think a quadratic would fit better. Did you try that? The value of C when A=0 will be higher than the 2.69 that txnelson calculated. In any case, you should provide a bit more context to your question: what exactly were you asked to do? Was a linear regression a condition for the question?
- Mark as New
- Bookmark
- Subscribe
- Mute
- Subscribe to RSS Feed
- Get Direct Link
- Report Inappropriate Content
Re: Linear Regression Interpreting output
I got only those two outputs from JMP that according to them I need to answer a few questions.
One of them was to find A when C=0.
I think you are all right and I just wanted to make sure...and tell the professor =]
Thank you!
Recommended Articles
- © 2026 JMP Statistical Discovery LLC. All Rights Reserved.
- Terms of Use
- Privacy Statement
- Contact Us