- Subscribe to RSS Feed
- Mark Topic as New
- Mark Topic as Read
- Float this Topic for Current User
- Bookmark
- Subscribe
- Mute
- Printer Friendly Page
Discussions
Solve problems, and share tips and tricks with other JMP users.- JMP User Community
- :
- Discussions
- :
- Line of fit graph builder
- Mark as New
- Bookmark
- Subscribe
- Mute
- Subscribe to RSS Feed
- Get Direct Link
- Report Inappropriate Content
Line of fit graph builder
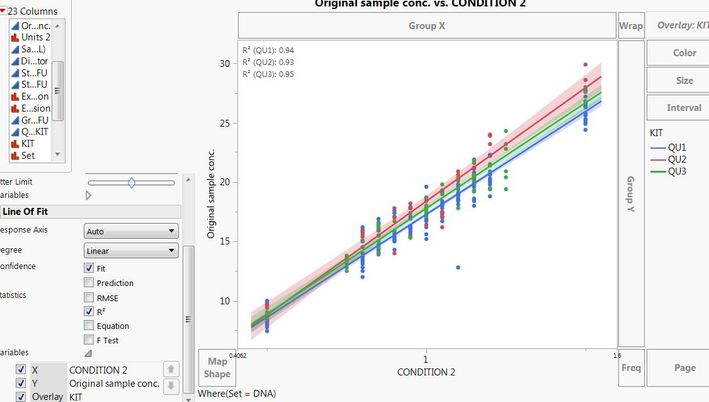
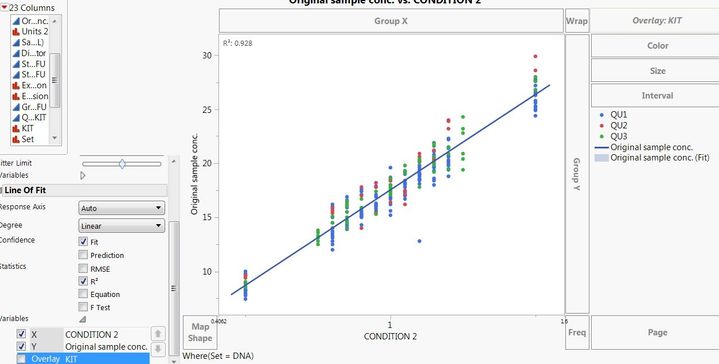
I am trying to show line of fit in graph builder for several sets of data. I want to show line of fit for each set induvidually as well as average for all 3.
I can turn on and off overlay for the variables but is there any way to get this all in the same graph?
Accepted Solutions
- Mark as New
- Bookmark
- Subscribe
- Mute
- Subscribe to RSS Feed
- Get Direct Link
- Report Inappropriate Content
Re: Line of fit graph builder
You can "cheat" and use the "copy frame contents" feature. Build your two plots as you show. On the plot with just the average line remove the points so you just have the line. In that plot, right click and "copy frame contents". In your grouped plot right click and "paste frame contents".
Recommended Articles
- © 2026 JMP Statistical Discovery LLC. All Rights Reserved.
- Terms of Use
- Privacy Statement
- Contact Us


