- Learn how to build custom Python data connectors and further customize JMP’s Data Connector Framework with the Python Data Connector Demo, available now in the JMP Marketplace!
- See how to move from signal modeling to system modeling at the first JMP Aerospace Analytics webinar. Register. June 18, 1 p.m. US Eastern Time.
- Subscribe to RSS Feed
- Mark Topic as New
- Mark Topic as Read
- Float this Topic for Current User
- Bookmark
- Subscribe
- Mute
- Printer Friendly Page
Discussions
Solve problems, and share tips and tricks with other JMP users.- JMP User Community
- :
- Discussions
- :
- JSL to generate box plot and save picture

- Mark as New
- Bookmark
- Subscribe
- Mute
- Subscribe to RSS Feed
- Get Direct Link
- Report Inappropriate Content
JSL to generate box plot and save picture
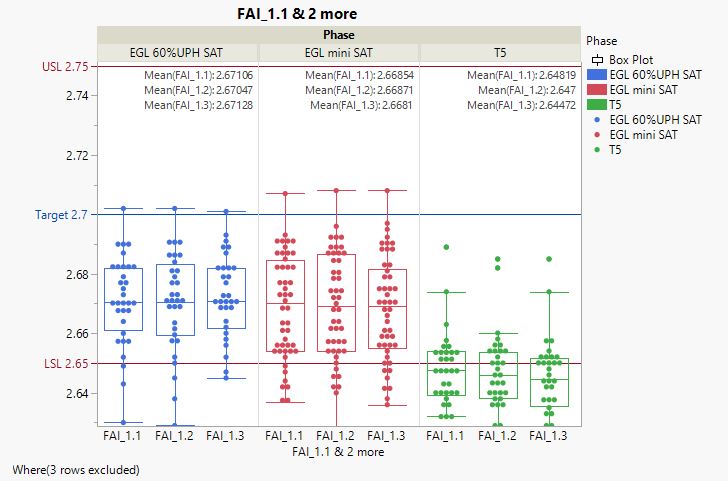
In "44322.jmp" has 28 FAI#, I want to change the script to save 28 pictures like "44322 - Graph Builder.jpg". I know the following ":FAI_1.1&:FAI_1.2&:FAI_1.3" need change, but don't know to change to what.
Variables(
	X( :FAI_1.1, Combine( "Parallel Merged" ) ),
	X( :FAI_1.2, Position( 1 ), Combine( "Parallel Merged" ) ),
	X( :FAI_1.3, Position( 1 ), Combine( "Parallel Merged" ) ),
	Group X( Phase ),
	Color( Phase )
),
- Tags:
- windows
Accepted Solutions

- Mark as New
- Bookmark
- Subscribe
- Mute
- Subscribe to RSS Feed
- Get Direct Link
- Report Inappropriate Content
Re: JSL to generate box plot and save picture
Here is a modification to the script that handles the 28 FAI's found in the data. It also adjusts the chart to compensate for the different number of columns found for each FAI.
Names Default To Here( 1 );
dt = Data Table( "44322.jmp" );
New Window( "Box Plot Compaire",

	Excluded( Row State( 1 ) ) = 1;
	Excluded( Row State( 2 ) ) = 1;
	Excluded( Row State( 3 ) ) = 1;
	For( i = 2, i < N Col() + 1, i++,
// determine the number of columns for the current FAI
		nFAI = 1;
		FAI = Word( 1, Column Name( i ), "." );
		Try( If( Word( 1, Column Name( i + 1 ), "." ) == FAI, nFAI = 2 ) );
		Try( If( Word( 1, Column Name( i + 2 ), "." ) == FAI, nFAI = 3 ) );
		If(
			nFAI == 3,
				mybox = Graph Builder(
					Size( 568, 458 ),
					Show Control Panel( 0 ),
					Variables(
						X( As Column( Column Name( i ) ), Position( 1 ), Combine( "Parallel Merged" ) ),
						X( As Column( Column Name( i + 1 ) ), Position( 1 ), Combine( "Parallel Merged" ) ),
						X( As Column( Column Name( i + 2 ) ), Position( 1 ), Combine( "Parallel Merged" ) ),
						Group X( Phase ),
						Color( Phase )
					),
					Elements(
						Box Plot( X( 1 ), X( 2 ), X( 3 ), Legend( 9 ) ),
						Points( X( 1 ), X( 2 ), X( 3 ), Legend( 10 ) ),
						Caption Box( X( 1 ), X( 2 ), X( 3 ), Legend( 11 ) )
					),
					SendToReport(
						Dispatch(
							{},
							"",
							ScaleBox,
							{Min(
								Col Min( Column( i ) ) - (Col Max( Column( i ) ) - Col Min( Column( i ) )) /
								100
							), Max(
								Col Max( Column( i ) ) + (Col Max( Column( i ) ) - Col Min( Column( i ) )) /
								100
							), /*Inc( (col max(column(i)) - col min(column(i)))/100 ),*/ Minor Ticks( 1 ),
							Add Ref Line(
								Column( i )[1],
								"Solid",
								"Dark Red",
								Eval Insert( "LSL ^column(i)[1]^" ),
								1
							), Add Ref Line(
								Column( i )[2],
								"Solid",
								"Dark Red",
								Eval Insert( "USL ^column(i)[2]^" ),
								1
							), Add Ref Line(
								Column( i )[3],
								"Solid",
								"Dark Blue",
								Eval Insert( "Target ^column(i)[3]^" ),
								1
							)}
						)
					)
				);,
			nFAI == 2,
				mybox = Graph Builder(
					Size( 568, 458 ),
					Show Control Panel( 0 ),
					Variables(
						X( As Column( Column Name( i ) ), Position( 1 ), Combine( "Parallel Merged" ) ),
						X( As Column( Column Name( i + 1 ) ), Position( 1 ), Combine( "Parallel Merged" ) ),
						Group X( Phase ),
						Color( Phase )
					),
					Elements(
						Box Plot( X( 1 ), X( 2 ), X( 3 ), Legend( 9 ) ),
						Points( X( 1 ), X( 2 ), X( 3 ), Legend( 10 ) ),
						Caption Box( X( 1 ), X( 2 ), X( 3 ), Legend( 11 ) )
					),
					SendToReport(
						Dispatch(
							{},
							"",
							ScaleBox,
							{Min(
								Col Min( Column( i ) ) - (Col Max( Column( i ) ) - Col Min( Column( i ) )) /
								100
							), Max(
								Col Max( Column( i ) ) + (Col Max( Column( i ) ) - Col Min( Column( i ) )) /
								100
							), /*Inc( (col max(column(i)) - col min(column(i)))/100 ),*/ Minor Ticks( 1 ),
							Add Ref Line(
								Column( i )[1],
								"Solid",
								"Dark Red",
								Eval Insert( "LSL ^column(i)[1]^" ),
								1
							), Add Ref Line(
								Column( i )[2],
								"Solid",
								"Dark Red",
								Eval Insert( "USL ^column(i)[2]^" ),
								1
							), Add Ref Line(
								Column( i )[3],
								"Solid",
								"Dark Blue",
								Eval Insert( "Target ^column(i)[3]^" ),
								1
							)}
						)
					)
				);,
			mybox = Graph Builder(
				Size( 568, 458 ),
				Show Control Panel( 0 ),
				Variables(
					X( As Column( Column Name( i ) ), Position( 1 ), Combine( "Parallel Merged" ) ),
					Group X( Phase ),
					Color( Phase )
				),
				Elements(
					Box Plot( X( 1 ), X( 2 ), X( 3 ), Legend( 9 ) ),
					Points( X( 1 ), X( 2 ), X( 3 ), Legend( 10 ) ),
					Caption Box( X( 1 ), X( 2 ), X( 3 ), Legend( 11 ) )
				),
				SendToReport(
					Dispatch(
						{},
						"",
						ScaleBox,
						{Min(
							Col Min( Column( i ) ) - (Col Max( Column( i ) ) - Col Min( Column( i ) )) / 100
						), Max(
							Col Max( Column( i ) ) + (Col Max( Column( i ) ) - Col Min( Column( i ) )) / 100
						), /*Inc( (col max(column(i)) - col min(column(i)))/100 ),*/ Minor Ticks( 1 ),
						Add Ref Line(
							Column( i )[1],
							"Solid",
							"Dark Red",
							Eval Insert( "LSL ^column(i)[1]^" ),
							1
						), Add Ref Line(
							Column( i )[2],
							"Solid",
							"Dark Red",
							Eval Insert( "USL ^column(i)[2]^" ),
							1
						), Add Ref Line(
							Column( i )[3],
							"Solid",
							"Dark Blue",
							Eval Insert( "Target ^column(i)[3]^" ),
							1
						)}
					)
				)
			);
		);

		Myboxplot = mybox << report;
		Myboxplot << save picture( FAI || ".emf", emf );

	// Increase variable i if nFAI is greater than 1
	i=i+nFAI-1;
	);

);
- Mark as New
- Bookmark
- Subscribe
- Mute
- Subscribe to RSS Feed
- Get Direct Link
- Report Inappropriate Content
Re: JSL to generate box plot and save picture
How should those column names change? One picture for each FAI_X (where X is number which might be followed by .Y)?
- Mark as New
- Bookmark
- Subscribe
- Mute
- Subscribe to RSS Feed
- Get Direct Link
- Report Inappropriate Content
Re: JSL to generate box plot and save picture
Here is a modification to the script that handles the 28 FAI's found in the data. It also adjusts the chart to compensate for the different number of columns found for each FAI.
Names Default To Here( 1 );
dt = Data Table( "44322.jmp" );
New Window( "Box Plot Compaire",

	Excluded( Row State( 1 ) ) = 1;
	Excluded( Row State( 2 ) ) = 1;
	Excluded( Row State( 3 ) ) = 1;
	For( i = 2, i < N Col() + 1, i++,
// determine the number of columns for the current FAI
		nFAI = 1;
		FAI = Word( 1, Column Name( i ), "." );
		Try( If( Word( 1, Column Name( i + 1 ), "." ) == FAI, nFAI = 2 ) );
		Try( If( Word( 1, Column Name( i + 2 ), "." ) == FAI, nFAI = 3 ) );
		If(
			nFAI == 3,
				mybox = Graph Builder(
					Size( 568, 458 ),
					Show Control Panel( 0 ),
					Variables(
						X( As Column( Column Name( i ) ), Position( 1 ), Combine( "Parallel Merged" ) ),
						X( As Column( Column Name( i + 1 ) ), Position( 1 ), Combine( "Parallel Merged" ) ),
						X( As Column( Column Name( i + 2 ) ), Position( 1 ), Combine( "Parallel Merged" ) ),
						Group X( Phase ),
						Color( Phase )
					),
					Elements(
						Box Plot( X( 1 ), X( 2 ), X( 3 ), Legend( 9 ) ),
						Points( X( 1 ), X( 2 ), X( 3 ), Legend( 10 ) ),
						Caption Box( X( 1 ), X( 2 ), X( 3 ), Legend( 11 ) )
					),
					SendToReport(
						Dispatch(
							{},
							"",
							ScaleBox,
							{Min(
								Col Min( Column( i ) ) - (Col Max( Column( i ) ) - Col Min( Column( i ) )) /
								100
							), Max(
								Col Max( Column( i ) ) + (Col Max( Column( i ) ) - Col Min( Column( i ) )) /
								100
							), /*Inc( (col max(column(i)) - col min(column(i)))/100 ),*/ Minor Ticks( 1 ),
							Add Ref Line(
								Column( i )[1],
								"Solid",
								"Dark Red",
								Eval Insert( "LSL ^column(i)[1]^" ),
								1
							), Add Ref Line(
								Column( i )[2],
								"Solid",
								"Dark Red",
								Eval Insert( "USL ^column(i)[2]^" ),
								1
							), Add Ref Line(
								Column( i )[3],
								"Solid",
								"Dark Blue",
								Eval Insert( "Target ^column(i)[3]^" ),
								1
							)}
						)
					)
				);,
			nFAI == 2,
				mybox = Graph Builder(
					Size( 568, 458 ),
					Show Control Panel( 0 ),
					Variables(
						X( As Column( Column Name( i ) ), Position( 1 ), Combine( "Parallel Merged" ) ),
						X( As Column( Column Name( i + 1 ) ), Position( 1 ), Combine( "Parallel Merged" ) ),
						Group X( Phase ),
						Color( Phase )
					),
					Elements(
						Box Plot( X( 1 ), X( 2 ), X( 3 ), Legend( 9 ) ),
						Points( X( 1 ), X( 2 ), X( 3 ), Legend( 10 ) ),
						Caption Box( X( 1 ), X( 2 ), X( 3 ), Legend( 11 ) )
					),
					SendToReport(
						Dispatch(
							{},
							"",
							ScaleBox,
							{Min(
								Col Min( Column( i ) ) - (Col Max( Column( i ) ) - Col Min( Column( i ) )) /
								100
							), Max(
								Col Max( Column( i ) ) + (Col Max( Column( i ) ) - Col Min( Column( i ) )) /
								100
							), /*Inc( (col max(column(i)) - col min(column(i)))/100 ),*/ Minor Ticks( 1 ),
							Add Ref Line(
								Column( i )[1],
								"Solid",
								"Dark Red",
								Eval Insert( "LSL ^column(i)[1]^" ),
								1
							), Add Ref Line(
								Column( i )[2],
								"Solid",
								"Dark Red",
								Eval Insert( "USL ^column(i)[2]^" ),
								1
							), Add Ref Line(
								Column( i )[3],
								"Solid",
								"Dark Blue",
								Eval Insert( "Target ^column(i)[3]^" ),
								1
							)}
						)
					)
				);,
			mybox = Graph Builder(
				Size( 568, 458 ),
				Show Control Panel( 0 ),
				Variables(
					X( As Column( Column Name( i ) ), Position( 1 ), Combine( "Parallel Merged" ) ),
					Group X( Phase ),
					Color( Phase )
				),
				Elements(
					Box Plot( X( 1 ), X( 2 ), X( 3 ), Legend( 9 ) ),
					Points( X( 1 ), X( 2 ), X( 3 ), Legend( 10 ) ),
					Caption Box( X( 1 ), X( 2 ), X( 3 ), Legend( 11 ) )
				),
				SendToReport(
					Dispatch(
						{},
						"",
						ScaleBox,
						{Min(
							Col Min( Column( i ) ) - (Col Max( Column( i ) ) - Col Min( Column( i ) )) / 100
						), Max(
							Col Max( Column( i ) ) + (Col Max( Column( i ) ) - Col Min( Column( i ) )) / 100
						), /*Inc( (col max(column(i)) - col min(column(i)))/100 ),*/ Minor Ticks( 1 ),
						Add Ref Line(
							Column( i )[1],
							"Solid",
							"Dark Red",
							Eval Insert( "LSL ^column(i)[1]^" ),
							1
						), Add Ref Line(
							Column( i )[2],
							"Solid",
							"Dark Red",
							Eval Insert( "USL ^column(i)[2]^" ),
							1
						), Add Ref Line(
							Column( i )[3],
							"Solid",
							"Dark Blue",
							Eval Insert( "Target ^column(i)[3]^" ),
							1
						)}
					)
				)
			);
		);

		Myboxplot = mybox << report;
		Myboxplot << save picture( FAI || ".emf", emf );

	// Increase variable i if nFAI is greater than 1
	i=i+nFAI-1;
	);

);- Mark as New
- Bookmark
- Subscribe
- Mute
- Subscribe to RSS Feed
- Get Direct Link
- Report Inappropriate Content
Re: JSL to generate box plot and save picture
As follows, "Min(……)" can use "::" to sample? I wrote "Min( Col Min( Column( i :: i + 12 )));" & "Min( Col Min( Column( i ) :: Col Min( Column( i + 12 )));"but its error.
For( i = 2, i < N Col() + 1, i++,
……
Min(Col Min( Column( i )), Col Min( Column( i + 1 )), Col Min( Column( i + 2 )), Col Min( Column( i + 3 )), Col Min( Column( i + 4 )), Col Min( Column( i + 5 )), Col Min( Column( i + 6 )), Col Min( Column( i + 7 )), Col Min( Column( i + 8 )), Col Min( Column( i + 9 )), Col Min( Column( i + 10 )), Col Min( Column( i + 11 )), Col Min( Column( i + 12 )));
……
);
Recommended Articles
- © 2026 JMP Statistical Discovery LLC. All Rights Reserved.
- Terms of Use
- Privacy Statement
- Contact Us