Turn on suggestions
Auto-suggest helps you quickly narrow down your search results by suggesting possible matches as you type.
- Don’t miss your chance to experience Discovery Summit Europe at our best available rate! Early bird registration through 31 Oct.
- Graph Builder Toolbar streamlines interactive graphing. Creates shortcuts on Report and GraphBuilder Helpers toolbars. Download and install the extension.
Options
- Subscribe to RSS Feed
- Mark Topic as New
- Mark Topic as Read
- Float this Topic for Current User
- Bookmark
- Subscribe
- Mute
- Printer Friendly Page
Discussions
Solve problems, and share tips and tricks with other JMP users.- User Community
- :
- Discussions
- :
- JSL create lines on graphs

Level III
- Mark as New
- Bookmark
- Subscribe
- Mute
- Subscribe to RSS Feed
- Get Direct Link
- Report Inappropriate Content
JSL create lines on graphs
Created:
May 23, 2021 12:42 PM
| Last Modified: Jun 9, 2023 12:47 PM
(2688 views)
Hello,
so I'm trying to create red lines that will be like in this script
Names Default To Here( 1 );

dt = Current Data Table();

listX = {"1"};
listY = {"test1", "test2", "test3"};
lowLine = 3;
highLine = 5;

bivExpr = Expr(
	Bivariate(
		Y( Eval List( listY ) ),
		X( Eval List( listx ) ),
		Fit Spline( 1, Standardized, {Line Color( "Blue" )} ),
		SendToReport(
			Dispatch(
				{},
				"Bivar Plot",
				FrameBox,
				{Add Graphics Script(
					2,
					Description( "Script" ),
					Pen Color( "Red" );
					Line Style( "dashed" );
					X Function( lowLine, x );
					X Function( highLine, x );
				), Grid Line Order( 1 ), Reference Line Order( 3 )}
			)
		)
	)
);

bivExpr;
and my table DT is like this:
| Group | test1 | test2 | test3 | 1 | 1 |
| BL | 1 | 1 | 1 | 1 | 1 |
| BL | 2 | 2 | 2 | 2 | 65 |
| BL | 23 | 3 | 6 | 1 | 1 |
| POR | 2 | 2 | 2 | 2 | 2 |
| Value1 | 1 | 1 | 1 | 3 | 4 |
| POR | 5 | 7 | 2 | 2 | 2 |
| Value1 | 7 | 5 | 1 | 7 | 3 |
| Value2 | 2 | 2 | 2 | 2 | 2 |
| Value0 | 8 | 1 | 1 | 1 | 6 |
result:
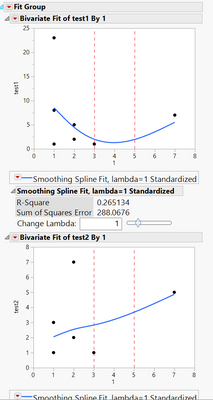
my question is how can I create different lines for each graph (for the first one 3-5 for the 2nd one 2-7 and so on dynamically)
thanks!
- Tags:
- Mass Customization
1 ACCEPTED SOLUTION
Accepted Solutions


Super User
Solution
- Mark as New
- Bookmark
- Subscribe
- Mute
- Subscribe to RSS Feed
- Get Direct Link
- Report Inappropriate Content
Re: JSL create lines on graphs
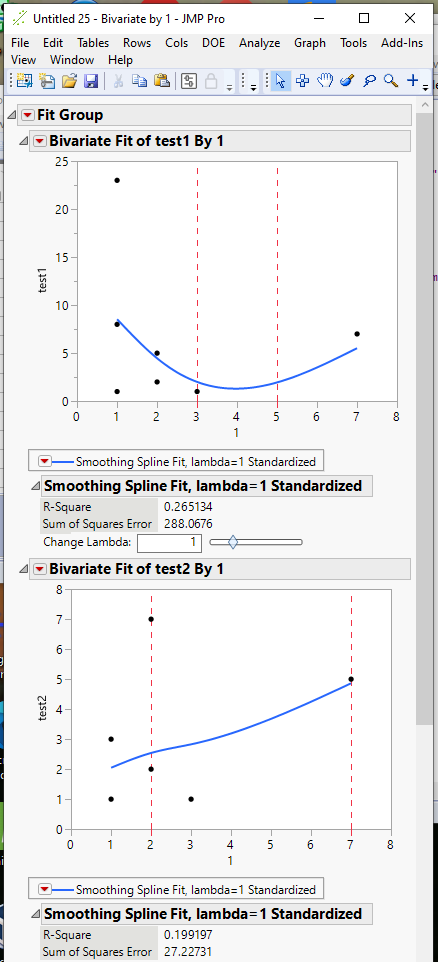
Using Reference Lines is how I would handle this
Names Default To Here( 1 );

dt = Current Data Table();

listX = {"1"};
listY = {"test1", "test2", "test3"};

lowList = {3, 2, 1};
highList = {5, 7, 9};

lowLine = 3;
highLine = 5;

bivExpr = Expr(
	biv = Bivariate(
		Y( Eval List( listY ) ),
		X( Eval List( listx ) ),
		Fit Spline( 1, Standardized, {Line Color( "Blue" )} )
	);
	For( i = 1, i <= N Items( listY ), i++,
		Report( biv[i] )[AxisBox( 2 )] << add Ref Line( lowList[i], "Dashed", "Red" );
		Report( biv[i] )[AxisBox( 2 )] << add Ref Line( highList[i], "Dashed", "Red" );
	);
);

bivExpr;
Jim
1 REPLY 1
Super User
Solution
- Mark as New
- Bookmark
- Subscribe
- Mute
- Subscribe to RSS Feed
- Get Direct Link
- Report Inappropriate Content
Re: JSL create lines on graphs
Using Reference Lines is how I would handle this
Names Default To Here( 1 );

dt = Current Data Table();

listX = {"1"};
listY = {"test1", "test2", "test3"};

lowList = {3, 2, 1};
highList = {5, 7, 9};

lowLine = 3;
highLine = 5;

bivExpr = Expr(
	biv = Bivariate(
		Y( Eval List( listY ) ),
		X( Eval List( listx ) ),
		Fit Spline( 1, Standardized, {Line Color( "Blue" )} )
	);
	For( i = 1, i <= N Items( listY ), i++,
		Report( biv[i] )[AxisBox( 2 )] << add Ref Line( lowList[i], "Dashed", "Red" );
		Report( biv[i] )[AxisBox( 2 )] << add Ref Line( highList[i], "Dashed", "Red" );
	);
);

bivExpr;
Jim
Recommended Articles
- © 2026 JMP Statistical Discovery LLC. All Rights Reserved.
- Terms of Use
- Privacy Statement
- Contact Us