- Subscribe to RSS Feed
- Mark Topic as New
- Mark Topic as Read
- Float this Topic for Current User
- Bookmark
- Subscribe
- Mute
- Printer Friendly Page
Discussions
Solve problems, and share tips and tricks with other JMP users.- JMP User Community
- :
- Discussions
- :
- Re: JMP17 Bottom Margin of Bivariate plot issue
- Mark as New
- Bookmark
- Subscribe
- Mute
- Subscribe to RSS Feed
- Get Direct Link
- Report Inappropriate Content
JMP17 Bottom Margin of Bivariate plot issue
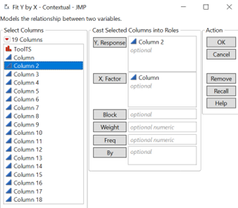
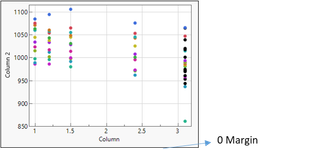
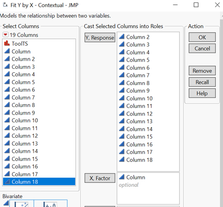
in JMP17, in bivariate Fit plot, when there are more and more Y columns to be plotted at the same time, and then when i copy the plot and paste to somewhere, it turns out wider and wider bottom margin, showed as below.
1) when there is only 1 Y column, there are no bottom margin when i copy the plot and paste to somewhere.
2) when there are multi Y columns to be plotted at the same time, there are some Margin when i copy and paste the plot
3) when there are more and more Y columns to be plotted at the same time, teh margin is getting wider and wider when i copy and paste the plot.
- Mark as New
- Bookmark
- Subscribe
- Mute
- Subscribe to RSS Feed
- Get Direct Link
- Report Inappropriate Content
Re: JMP17 Bottom Margin of Bivariate plot issue
does anyone know this or encounter the same issue, anyway to fix it. Thanks
- Mark as New
- Bookmark
- Subscribe
- Mute
- Subscribe to RSS Feed
- Get Direct Link
- Report Inappropriate Content
Re: JMP17 Bottom Margin of Bivariate plot issue
How are you trying to copy the image?
- Mark as New
- Bookmark
- Subscribe
- Mute
- Subscribe to RSS Feed
- Get Direct Link
- Report Inappropriate Content
Re: JMP17 Bottom Margin of Bivariate plot issue
Just Ctrl+C
- Mark as New
- Bookmark
- Subscribe
- Mute
- Subscribe to RSS Feed
- Get Direct Link
- Report Inappropriate Content
Re: JMP17 Bottom Margin of Bivariate plot issue
Just Ctrl+C, and we never encountered this issue in previous version
- Mark as New
- Bookmark
- Subscribe
- Mute
- Subscribe to RSS Feed
- Get Direct Link
- Report Inappropriate Content
Re: JMP17 Bottom Margin of Bivariate plot issue
What do you select before you Ctrl+C? JMP17 could have changed the display box structure somehow which then could add some additional whitespace when new plots are added
- Mark as New
- Bookmark
- Subscribe
- Mute
- Subscribe to RSS Feed
- Get Direct Link
- Report Inappropriate Content
Re: JMP17 Bottom Margin of Bivariate plot issue
I just click the selection button, then select and copy the plot, and then paste. That is the same way as i have been doing in previous versions, i have never encountered this issue from JMP14, 15, 16.
the more Y columns to be plotted at the same time, the wider whitespace is after you paste, but as you can see, the original plot before paste has no whitespace. Thanks
Recommended Articles
- © 2026 JMP Statistical Discovery LLC. All Rights Reserved.
- Terms of Use
- Privacy Statement
- Contact Us


