- Discovery Summit 2026: Early User Edition - September 23-24.Register. It's free.
- Graph Builder Toolbar streamlines interactive graphing. Creates shortcuts on Report and GraphBuilder Helpers toolbars. Download and install the extension.
- Subscribe to RSS Feed
- Mark Topic as New
- Mark Topic as Read
- Float this Topic for Current User
- Bookmark
- Subscribe
- Mute
- Printer Friendly Page
Discussions
Solve problems, and share tips and tricks with other JMP users.- User Community
- :
- Discussions
- :
- JMP 16.1 > GraphBuilder > Binary Categorical Variable (0,1) > Bar Graph: How do ...


- Mark as New
- Bookmark
- Subscribe
- Mute
- Subscribe to RSS Feed
- Get Direct Link
- Report Inappropriate Content
JMP 16.1 > GraphBuilder > Binary Categorical Variable (0,1) > Bar Graph: How do I get the bars to span the range of % instead of a simple line?
Hi JMP Community,
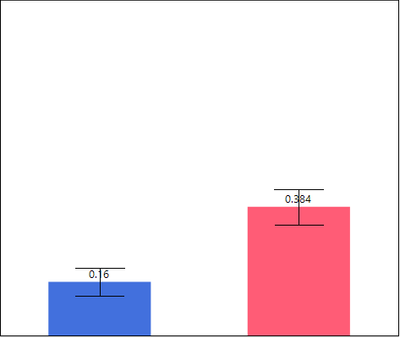
I recently upgraded JMP to version 16.1 (Windows), and I tried to rerun saved GraphBuilder bar plots where Y is a binary categorical variable (0,1), and X is also a categorical variable. In JMP 14.1, these GB scripts would yield full bars with a floor at 0 and a top at the frequency of 1's as shown below.
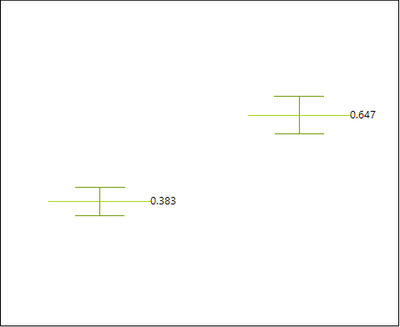
Now, when I try to reproduce these plots in JMP 16.1, I get the following output (note the data is not precisely the same, but the setup is)
Any tips on how to restore the "vintage" output?
Thanks.
Best
TS
Accepted Solutions
- Mark as New
- Bookmark
- Subscribe
- Mute
- Subscribe to RSS Feed
- Get Direct Link
- Report Inappropriate Content
Re: JMP 16.1 > GraphBuilder > Binary Categorical Variable (0,1) > Bar Graph: How do I get the bars to span the range of % instead of a simple line?
Hi,
Thank you for your suggestion, but the solution is even simpler: in JMP 16.1, binary data need to be categorized as Continuous to yield the bar full bar plots; otherwise, whatever the style of bars you choose, GB will only plot a "floating" bar.
Best,
TS

- Mark as New
- Bookmark
- Subscribe
- Mute
- Subscribe to RSS Feed
- Get Direct Link
- Report Inappropriate Content
Re: JMP 16.1 > GraphBuilder > Binary Categorical Variable (0,1) > Bar Graph: How do I get the bars to span the range of % instead of a simple line?
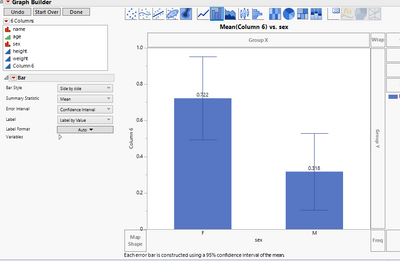
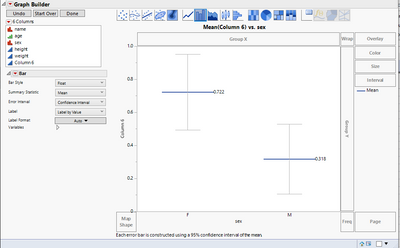
Without seeing the script I can only give a guess: Seems like JMP16 could be using Float bar style instead of Side by Side. Maybe you could open the Control Panel in the "wrong" graph builder and try to see which settings it is using (or determine that directly from script, but it might miss some preferences)
Side by side:
Float:
- Mark as New
- Bookmark
- Subscribe
- Mute
- Subscribe to RSS Feed
- Get Direct Link
- Report Inappropriate Content
Re: JMP 16.1 > GraphBuilder > Binary Categorical Variable (0,1) > Bar Graph: How do I get the bars to span the range of % instead of a simple line?
Hi,
Thank you for your suggestion, but the solution is even simpler: in JMP 16.1, binary data need to be categorized as Continuous to yield the bar full bar plots; otherwise, whatever the style of bars you choose, GB will only plot a "floating" bar.
Best,
TS
- Mark as New
- Bookmark
- Subscribe
- Mute
- Subscribe to RSS Feed
- Get Direct Link
- Report Inappropriate Content
Re: JMP 16.1 > GraphBuilder > Binary Categorical Variable (0,1) > Bar Graph: How do I get the bars to span the range of % instead of a simple line?
Next thing I'm wondering, is this intended behavior? @XanGregg
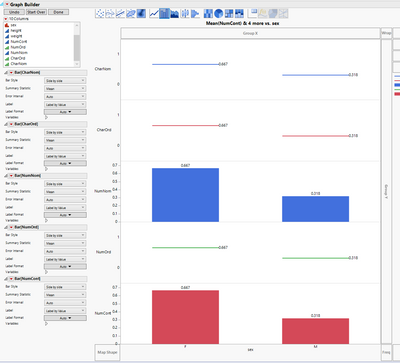
Quickly testing seems like Bar Style options do nothing on Numeric Ordinal data or Character data.


- Mark as New
- Bookmark
- Subscribe
- Mute
- Subscribe to RSS Feed
- Get Direct Link
- Report Inappropriate Content
Re: JMP 16.1 > GraphBuilder > Binary Categorical Variable (0,1) > Bar Graph: How do I get the bars to span the range of % instead of a simple line?
Yes, it is intentional. Bars usually don't make sense for categorical data, without a clear baseline or even spacing. Having numeric integer categories is the exception, but hopefully a continuous modeling type is not a burden there.
- Mark as New
- Bookmark
- Subscribe
- Mute
- Subscribe to RSS Feed
- Get Direct Link
- Report Inappropriate Content
Re: JMP 16.1 > GraphBuilder > Binary Categorical Variable (0,1) > Bar Graph: How do I get the bars to span the range of % instead of a simple line?
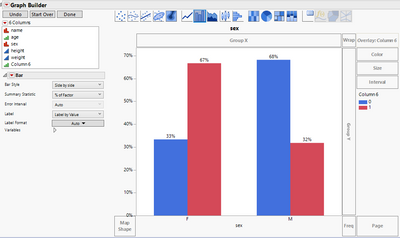
Re-thinking this that makes sense.You would visualize Nominal/ordinal values by using Overlay or other X-grouping:
Would it be possible to disable other selections besides Float if data type isn't continuous to make it more obvious? If Combo Box doesn't allow disabling specific selections, could it be updated to show only the Float option and add "?" button next to Combo Box to explain why it is like that?
Recommended Articles
- © 2026 JMP Statistical Discovery LLC. All Rights Reserved.
- Terms of Use
- Privacy Statement
- Contact Us