- Don’t miss your chance to experience Discovery Summit Europe at our best available rate! Early bird registration through 31 Oct.
- Graph Builder Toolbar streamlines interactive graphing. Creates shortcuts on Report and GraphBuilder Helpers toolbars. Download and install the extension.
- Subscribe to RSS Feed
- Mark Topic as New
- Mark Topic as Read
- Float this Topic for Current User
- Bookmark
- Subscribe
- Mute
- Printer Friendly Page
Discussions
Solve problems, and share tips and tricks with other JMP users.- User Community
- :
- Discussions
- :
- Re: Is there a way to set UCL to round up or down to the nearest whole number fo...

- Mark as New
- Bookmark
- Subscribe
- Mute
- Subscribe to RSS Feed
- Get Direct Link
- Report Inappropriate Content
Is there a way to set UCL to round up or down to the nearest whole number for the generated graph?
For my teams' purposes with JMP our limits and UCL have to be rounded to the nearest whole number. Is there any way to have that reflected when generating the Levey Jennings chart? Ideally in the attached example the UCL is rounded to just be "2" and the raw data entered as "2" would be shown to rest exactly on the purple UCL line.
Thank you!


- Mark as New
- Bookmark
- Subscribe
- Mute
- Subscribe to RSS Feed
- Get Direct Link
- Report Inappropriate Content
Re: Is there a way to set UCL to round up or down to the nearest whole number for the generated graph?
I think you would have to save the control limit to column properties and then go edit them to get the rounded values.


- Mark as New
- Bookmark
- Subscribe
- Mute
- Subscribe to RSS Feed
- Get Direct Link
- Report Inappropriate Content
Re: Is there a way to set UCL to round up or down to the nearest whole number for the generated graph?
This will work if you have the spec limits already saved as a column property:
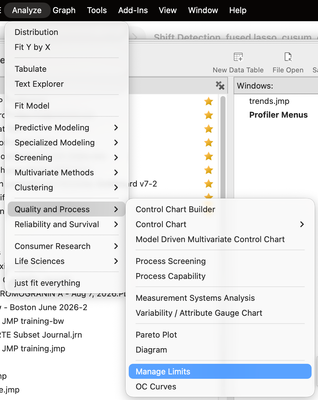
Go to the manage limits platform, Save the spec limits in a Tall Table.
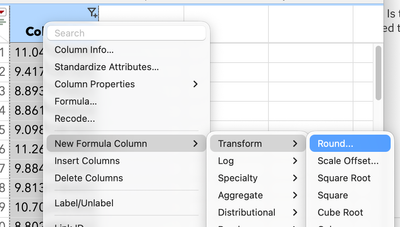
click on the USL column header and make a new column formula, like in the figure below, and round the col of numbers appropriately
Do the same thing for the LSL column.
Copy the rounded values back into the LSL and USL cols, name the table Spec Limits, and then go back to Manage limits,
Two important steps, Load limits to Table, then Copy to Column properties
I'm not sure if the workflow builder will follow all these steps, but really it just a little clicking around.
...and I'm sure someone will post a script that iterates through the columns, and if the column has a spec limit property, take the value and round it and set the column property with the rounded value.
also, I totally ignored that you're using LJ charts: https://community.jmp.com/t5/Abstracts/Friends-Don-t-Let-Friends-Misuse-Levey-Jennings-Charts-2023-U...

Recommended Articles
- © 2026 JMP Statistical Discovery LLC. All Rights Reserved.
- Terms of Use
- Privacy Statement
- Contact Us