- Don’t miss your chance to experience Discovery Summit Europe at our best available rate! Early bird registration through 31 Oct.
- Graph Builder Toolbar streamlines interactive graphing. Creates shortcuts on Report and GraphBuilder Helpers toolbars. Download and install the extension.
- Subscribe to RSS Feed
- Mark Topic as New
- Mark Topic as Read
- Float this Topic for Current User
- Bookmark
- Subscribe
- Mute
- Printer Friendly Page
Discussions
Solve problems, and share tips and tricks with other JMP users.- User Community
- :
- Discussions
- :
- Levey Jennings charts with subgroups gives wrong limits

- Mark as New
- Bookmark
- Subscribe
- Mute
- Subscribe to RSS Feed
- Get Direct Link
- Report Inappropriate Content
Levey Jennings charts with subgroups gives wrong limits
Hi,
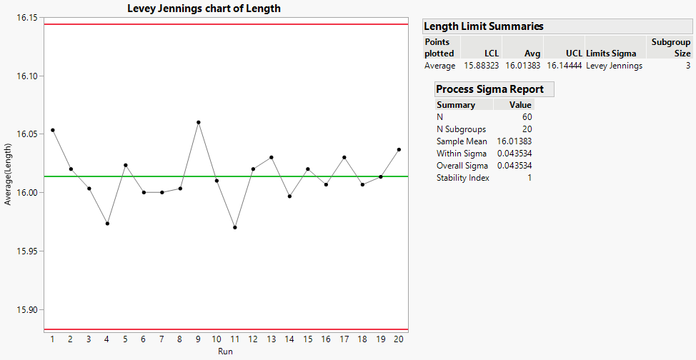
As indicated in other threads, there are several issues with applying Levey Jennings control charts. But when your data set has subgroups JMP just seems to miscalculate the control limits! The chart generated is for the average within subgroup but the calculated limits are for individual measurements as seen below, giving too wide limits. It appears that division by the square root of subgroup size is missing from the formula.
Best regards,
Stefan


- Mark as New
- Bookmark
- Subscribe
- Mute
- Subscribe to RSS Feed
- Get Direct Link
- Report Inappropriate Content
Re: Levey Jennings charts with subgroups gives wrong limits


- Mark as New
- Bookmark
- Subscribe
- Mute
- Subscribe to RSS Feed
- Get Direct Link
- Report Inappropriate Content
Re: Levey Jennings charts with subgroups gives wrong limits
I would prefer not to use the Levey Jennings chart. If the process is expected to have between group variation, I would probably use the Three way chart. If not, I would use the X bar and R chart.
Best regards,
Stefan
- Mark as New
- Bookmark
- Subscribe
- Mute
- Subscribe to RSS Feed
- Get Direct Link
- Report Inappropriate Content
Re: Levey Jennings charts with subgroups gives wrong limits
Then don't use it? And if there is a bug in JMP, please contact JMP support.


- Mark as New
- Bookmark
- Subscribe
- Mute
- Subscribe to RSS Feed
- Get Direct Link
- Report Inappropriate Content
Re: Levey Jennings charts with subgroups gives wrong limits
I wouldn't use Levy Jennings charts either, they were design for specific purpose. In QC labs, some standards for very defined Stddev. In a LJ chart you can specify that sigma to see if you method is in control. Everyone else that uses to hide OOC events that they should be responding to, since frequent recalculation of the limits just keeps fitting the common and special cause in the process.
Recommended Articles
- © 2026 JMP Statistical Discovery LLC. All Rights Reserved.
- Terms of Use
- Privacy Statement
- Contact Us