Turn on suggestions
Auto-suggest helps you quickly narrow down your search results by suggesting possible matches as you type.
- Instantly extract effect sizes, F-ratios, and FDR-adjusted p-values from your models with the Calculate Effects Sizes extension, available now in the JMP Marketplace!
- New to JMP? Join us Sept. 23-24 for the Early User Edition of Discovery Summit, tailor-made for new users. Register now for free!
- Your voice matters! Tell us how you prefer to receive JMP updates, so we can tailor our communication to your needs. Take short survey.
Options
- Subscribe to RSS Feed
- Mark Topic as New
- Mark Topic as Read
- Float this Topic for Current User
- Bookmark
- Subscribe
- Mute
- Printer Friendly Page
Discussions
Solve problems, and share tips and tricks with other JMP users.- JMP User Community
- :
- Discussions
- :
- Is there a way to move the default distributions chart "Quantiles" & "Summary St...

Level I
- Mark as New
- Bookmark
- Subscribe
- Mute
- Subscribe to RSS Feed
- Get Direct Link
- Report Inappropriate Content
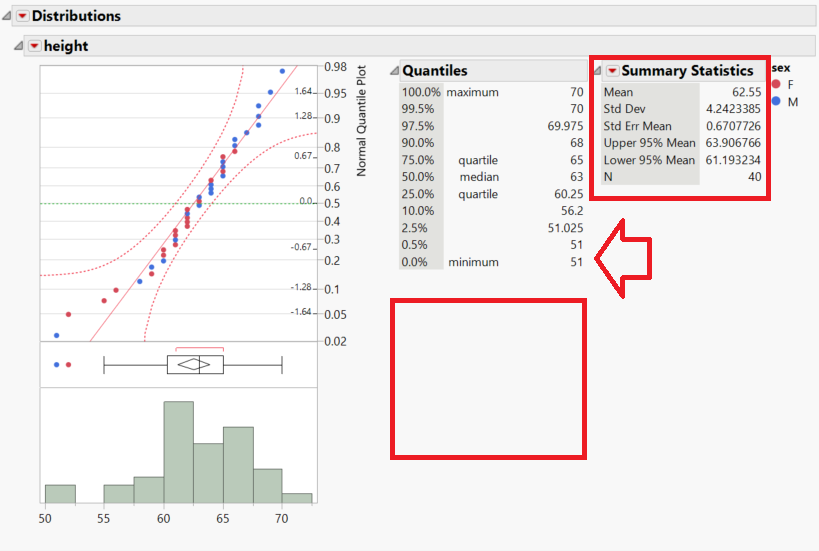
Is there a way to move the default distributions chart "Quantiles" & "Summary Statistics" into the same column?
Aug 8, 2023 03:41 PM
(2625 views)
// Using sample data, I can generate a distribution chart using the following script:

dt = Open( "$SAMPLE_DATA/Big Class.jmp" );
rep = dt << Distribution(
	Stack( 1 ),
	Continuous Distribution(
		Column( :height ),
		Horizontal Layout( 1 ),
		Vertical( 0 ),
		Normal Quantile Plot( 1 ),
		PpK Capability Labeling( 0 )
	)
);
Report(rep)[Frame box(1)] << Row Legend("sex", color(1), marker(0));

// Is there a way to move the "Summary Statistics" box to under "Quantiles" box?
// I tried changing "Horizontal Layout(1)" to "Vertical Layout (1)", and don't see much difference.
// Can you suggest what help file that I can read about that?- Tags:
- windows
1 ACCEPTED SOLUTION
Accepted Solutions

Super User
Solution
- Mark as New
- Bookmark
- Subscribe
- Mute
- Subscribe to RSS Feed
- Get Direct Link
- Report Inappropriate Content
Re: Is there a way to move the default distributions chart "Quantiles" & "Summary Statistics" into the same column?
Created:
Aug 8, 2023 03:51 PM
| Last Modified: Aug 8, 2023 1:00 PM
(2620 views)
| Posted in reply to message from RLo 08-08-2023
I would think how to make this a bit more robust, but you can change the Horizontal of the list box which contains those OutlineBoxes to 0
Names Default To Here(1);

dt = Open("$SAMPLE_DATA/Big Class.jmp");
dist = dt << Distribution(
	Continuous Distribution(
		Column(:height),
		Horizontal Layout(1),
		Vertical(0),
		Normal Quantile Plot(1),
		PpK Capability Labeling(0)
	)
);

lb = ((Report(dist)["Quantiles"] << parent) << parent) << Set Horizontal(0);
Edit:
If you have to do this only once and you don't want to script, you can also do this interactively using display tree's properties (this doesn't seem to be captured in the script created by JMP)

-Jarmo
1 REPLY 1
Super User
Solution
- Mark as New
- Bookmark
- Subscribe
- Mute
- Subscribe to RSS Feed
- Get Direct Link
- Report Inappropriate Content
Re: Is there a way to move the default distributions chart "Quantiles" & "Summary Statistics" into the same column?
Created:
Aug 8, 2023 03:51 PM
| Last Modified: Aug 8, 2023 1:00 PM
(2621 views)
| Posted in reply to message from RLo 08-08-2023
I would think how to make this a bit more robust, but you can change the Horizontal of the list box which contains those OutlineBoxes to 0
Names Default To Here(1);

dt = Open("$SAMPLE_DATA/Big Class.jmp");
dist = dt << Distribution(
	Continuous Distribution(
		Column(:height),
		Horizontal Layout(1),
		Vertical(0),
		Normal Quantile Plot(1),
		PpK Capability Labeling(0)
	)
);

lb = ((Report(dist)["Quantiles"] << parent) << parent) << Set Horizontal(0);
Edit:
If you have to do this only once and you don't want to script, you can also do this interactively using display tree's properties (this doesn't seem to be captured in the script created by JMP)
-Jarmo
Recommended Articles
- © 2026 JMP Statistical Discovery LLC. All Rights Reserved.
- Terms of Use
- Privacy Statement
- Contact Us