- Don’t miss your chance to experience Discovery Summit Europe at our best available rate! Early bird registration through 31 Oct.
- Graph Builder Toolbar streamlines interactive graphing. Creates shortcuts on Report and GraphBuilder Helpers toolbars. Download and install the extension.
- Subscribe to RSS Feed
- Mark Topic as New
- Mark Topic as Read
- Float this Topic for Current User
- Bookmark
- Subscribe
- Mute
- Printer Friendly Page
Discussions
Solve problems, and share tips and tricks with other JMP users.- User Community
- :
- Discussions
- :
- Re: Is it possible to execute a script by clicking a curve in the graph via JSL?
- Mark as New
- Bookmark
- Subscribe
- Mute
- Subscribe to RSS Feed
- Get Direct Link
- Report Inappropriate Content
Is it possible to execute a script by clicking a curve in the graph via JSL?
For example, I made a graph of the script below.
dt = Open( "$SAMPLE_DATA/Students2.JMP" );
dt << Sort( By( 1 ), Order( Ascending ), replacetable( 1 ) );
New Column( "A" );
Column( "A" ) << Formula( If( Row() == 1 | name != Lag( name, 1 ), 1, If( Lag( A, 1 ) < 6, Lag( A, 1 ) + 1 ) ) );
dt << run formulas;
Column( "A" ) << deleteFormula;
dt << Sort( By( "A" ), Order( DEscending ), replacetable( 1 ) );
dt << delete rows( N Rows( Loc( dt[0, "A"] > 0 ) ) + 1 :: N Row( dt ) );
dt << Sort( By( 1, "A" ), Order( Ascending, Ascending ), replacetable( 1 ) );

p1 = Graph Builder(
	Size( 528, 454 ),
	Show Control Panel( 0 ),
	Variables( X( :A ), Y( :height ), Overlay( :name ) ),
	Elements( Points( X, Y, Legend( 8 ) ), Smoother( X, Y, Legend( 9 ) ) )
);
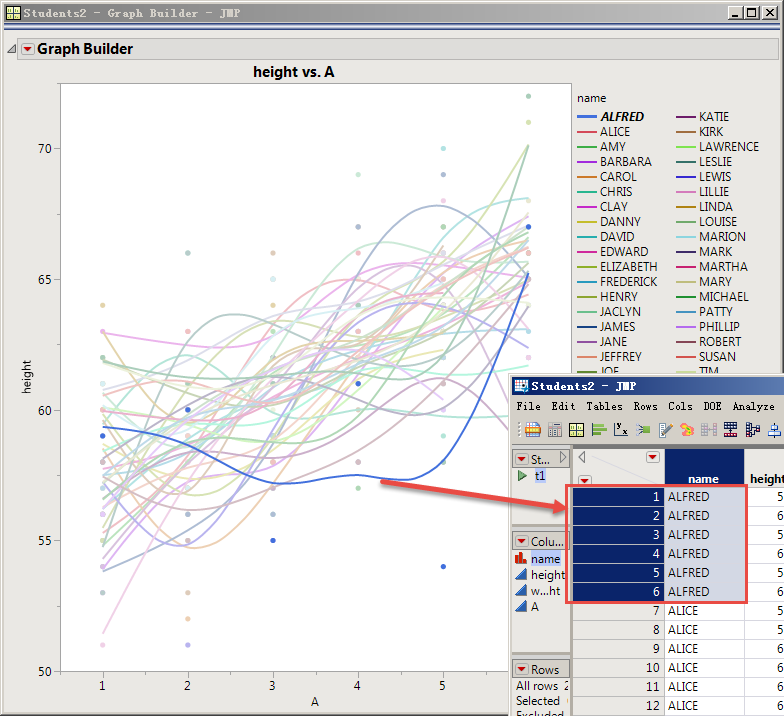
Click any conditional curve in the graph, and automatically run the specified "D :\ A.jsl"
Thanks!
- Mark as New
- Bookmark
- Subscribe
- Mute
- Subscribe to RSS Feed
- Get Direct Link
- Report Inappropriate Content
Re: Is it possible to execute a script by clicking a curve in the graph via JSL?
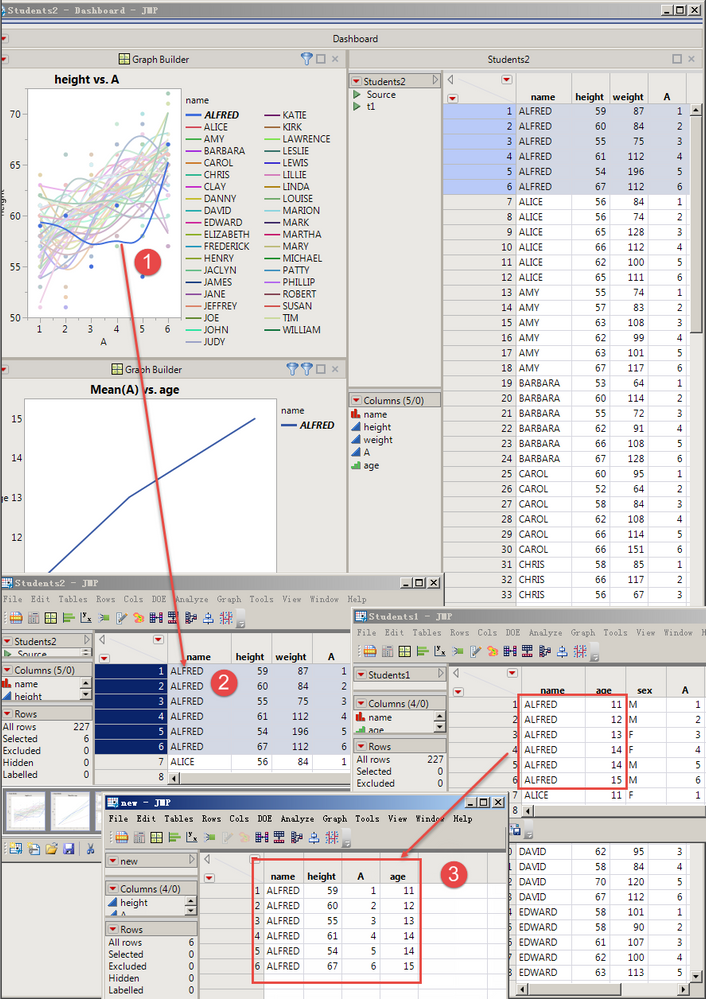
This "D:\A.JSL"、I mainly achieve the following functions:
Click on the selected curve to get the "name".Use this name to get the "age" of the name in another table"Students1.JMP".Create new table "new.jmp"
Draw the diagram as above.
Finally, the two graphs and each data table are used to generate a dashboard.
- Mark as New
- Bookmark
- Subscribe
- Mute
- Subscribe to RSS Feed
- Get Direct Link
- Report Inappropriate Content
Re: Is it possible to execute a script by clicking a curve in the graph via JSL?
JMP has similar module function, can realize the following process operation:
by clicking the selected curve, get the "name".Use this name to get the age of the name in the other table students1.jmp.A new data table is generated with the selected name alone and the "height" in Table 2 and the "age" in Table 1.
d1 = Open( "$SAMPLE_DATA/Students1.JMP" );Thanks Experts!


- Mark as New
- Bookmark
- Subscribe
- Mute
- Subscribe to RSS Feed
- Get Direct Link
- Report Inappropriate Content
Re: Is it possible to execute a script by clicking a curve in the graph via JSL?
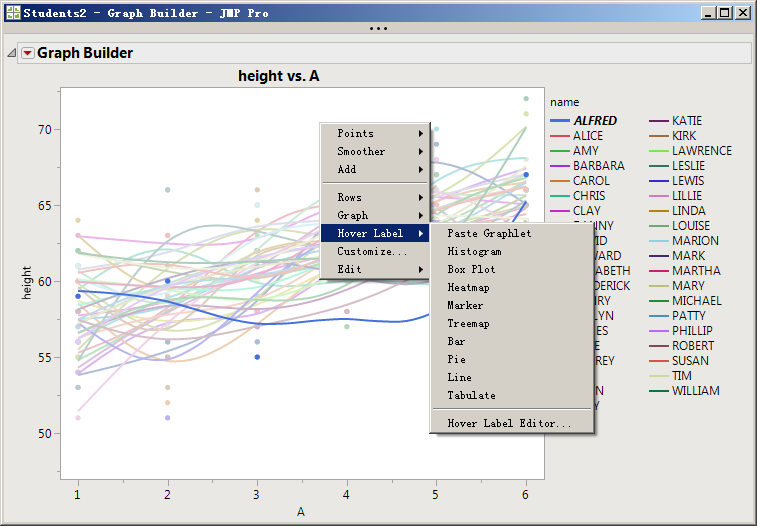
Maybe using Row State Handler on the original data table could work? Or if you can "skip" the clicking part then you could possibly use hover labels.
- Mark as New
- Bookmark
- Subscribe
- Mute
- Subscribe to RSS Feed
- Get Direct Link
- Report Inappropriate Content
Re: Is it possible to execute a script by clicking a curve in the graph via JSL?
Thank you very much! But I still haven't found a way.
- Mark as New
- Bookmark
- Subscribe
- Mute
- Subscribe to RSS Feed
- Get Direct Link
- Report Inappropriate Content
Re: Is it possible to execute a script by clicking a curve in the graph via JSL?
- Mark as New
- Bookmark
- Subscribe
- Mute
- Subscribe to RSS Feed
- Get Direct Link
- Report Inappropriate Content
Re: Is it possible to execute a script by clicking a curve in the graph via JSL?

- Mark as New
- Bookmark
- Subscribe
- Mute
- Subscribe to RSS Feed
- Get Direct Link
- Report Inappropriate Content
Re: Is it possible to execute a script by clicking a curve in the graph via JSL?
Perhaps I'm missing some nuance of what's needed. But building on the suggestion from @jthi, you can do this kind of thing (where, once you have the current row selection 'doSomething' can be made to do whatever JSL is capable of):
NamesDefaultToHere(1);

// Original code . . .
dt = Open( "$SAMPLE_DATA/Students2.JMP" );
dt << Sort( By( 1 ), Order( Ascending ), replacetable( 1 ) );
New Column( "A" );
Column( "A" ) << Formula( If( Row() == 1 | name != Lag( name, 1 ), 1, If( Lag( A, 1 ) < 6, Lag( A, 1 ) + 1 ) ) );
dt << run formulas;
Column( "A" ) << deleteFormula;
dt << Sort( By( "A" ), Order( DEscending ), replacetable( 1 ) );
dt << delete rows( N Rows( Loc( dt[0, "A"] > 0 ) ) + 1 :: N Row( dt ) );
dt << Sort( By( 1, "A" ), Order( Ascending, Ascending ), replacetable( 1 ) );

gb = dt <<
Graph Builder(
	Size( 528, 454 ),
	Show Control Panel( 0 ),
	Variables( X( :A ), Y( :height ), Overlay( :name ) ),
	Elements( Points( X, Y, Legend( 8 ) ), Smoother( X, Y, Legend( 9 ) ) )
);

// New code  . . .

// Row state handler function to do something
doSomething = Function({x}, {Default Local},
						// 'x' is a column vector of row states that have just CHANGED. We just need those that are now selected . . .
						selectedRows = [];
						For( i = 1, i <= NRow(x), i++, If( Selected( Row State( x[i] ) ), selectedRows = VConcat(selectedRows, x[i]) ));
						Print(x);
						Print(selectedRows);
						);
// Assign the handler to the table
rsh = dt << MakeRowStateHandler(doSomething);
Recommended Articles
- © 2026 JMP Statistical Discovery LLC. All Rights Reserved.
- Terms of Use
- Privacy Statement
- Contact Us