- New to JMP? Let the Data Analysis Director guide you through selecting an analysis task, an analysis goal, and a data type. Available now in the JMP Marketplace!
- See how to install JMP Marketplace extensions to customize and enhance JMP.
- Subscribe to RSS Feed
- Mark Topic as New
- Mark Topic as Read
- Float this Topic for Current User
- Bookmark
- Subscribe
- Mute
- Printer Friendly Page
Discussions
Solve problems, and share tips and tricks with other JMP users.- JMP User Community
- :
- Discussions
- :
- Re: Is OpenStreetMap for street-level background maps working?

- Mark as New
- Bookmark
- Subscribe
- Mute
- Subscribe to RSS Feed
- Get Direct Link
- Report Inappropriate Content
Is OpenStreetMap for street-level background maps working?
I have been trying to use OpenStreetMap mapping in a graph of sample locations in JMP Pro 15 - something I have done many time before.
However, when trying today, although the "© OpenStreetMap contributors" watermark appears at the bottom of the plot, no map is drawn. My latitude and longitude columns are in the correct format. If I "zoom out" by changing the x-axis scale, then the map is drawn when I get far enough out, but this is way less than "street level" detail, and there has been much higher detail available in Denmark previously (See attached screenshots).


Accepted Solutions

- Mark as New
- Bookmark
- Subscribe
- Mute
- Subscribe to RSS Feed
- Get Direct Link
- Report Inappropriate Content
Re: Is OpenStreetMap for street-level background maps working?
I am not sure why this might have changed, but one option might be to use a different web map service, for example this one:
https://www.terrestris.de/en/openstreetmap-wms/
In the 'Set Background Map' dialog, select 'Web Map Service' and enter this:
URL: https://ows.terrestris.de/osm-gray/service?
Layer: OSM-WMS
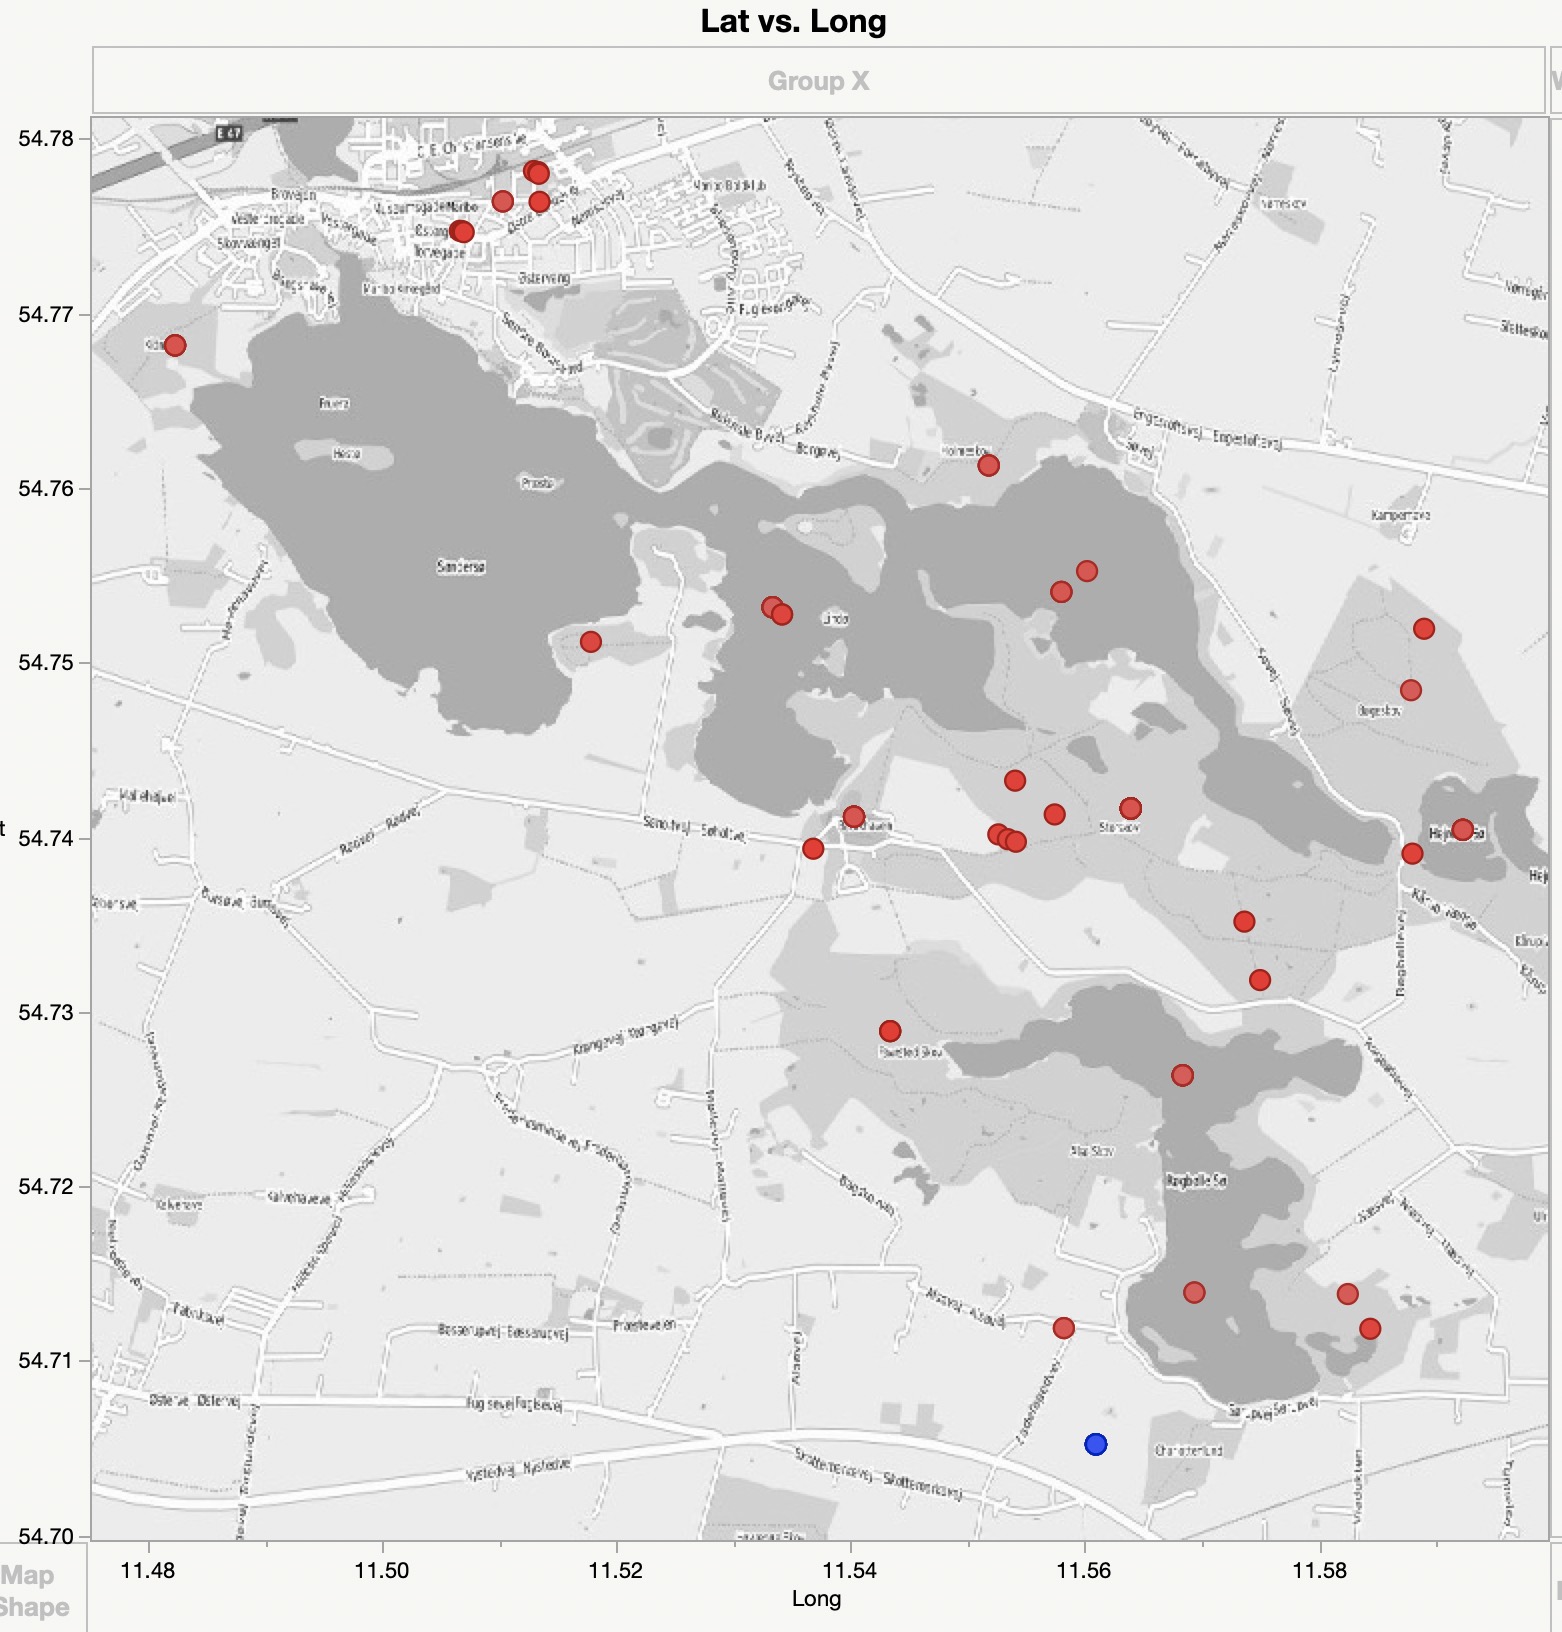
Should give this level of detail in graph builder:

- Mark as New
- Bookmark
- Subscribe
- Mute
- Subscribe to RSS Feed
- Get Direct Link
- Report Inappropriate Content
Re: Is OpenStreetMap for street-level background maps working?
I am not sure why this might have changed, but one option might be to use a different web map service, for example this one:
https://www.terrestris.de/en/openstreetmap-wms/
In the 'Set Background Map' dialog, select 'Web Map Service' and enter this:
URL: https://ows.terrestris.de/osm-gray/service?
Layer: OSM-WMS
Should give this level of detail in graph builder:
- Mark as New
- Bookmark
- Subscribe
- Mute
- Subscribe to RSS Feed
- Get Direct Link
- Report Inappropriate Content
Re: Is OpenStreetMap for street-level background maps working?
Thanks @ih that works, and it is nice to have the grey background - but it would be good to have the built-in mapping service working.

- Mark as New
- Bookmark
- Subscribe
- Mute
- Subscribe to RSS Feed
- Get Direct Link
- Report Inappropriate Content
Re: Is OpenStreetMap for street-level background maps working?
The JMP OpenStreetMap server needed to be restarted. It should be running properly now. Sorry for the downtime.
- Mark as New
- Bookmark
- Subscribe
- Mute
- Subscribe to RSS Feed
- Get Direct Link
- Report Inappropriate Content
Re: Is OpenStreetMap for street-level background maps working?
Hi @jschroedl,
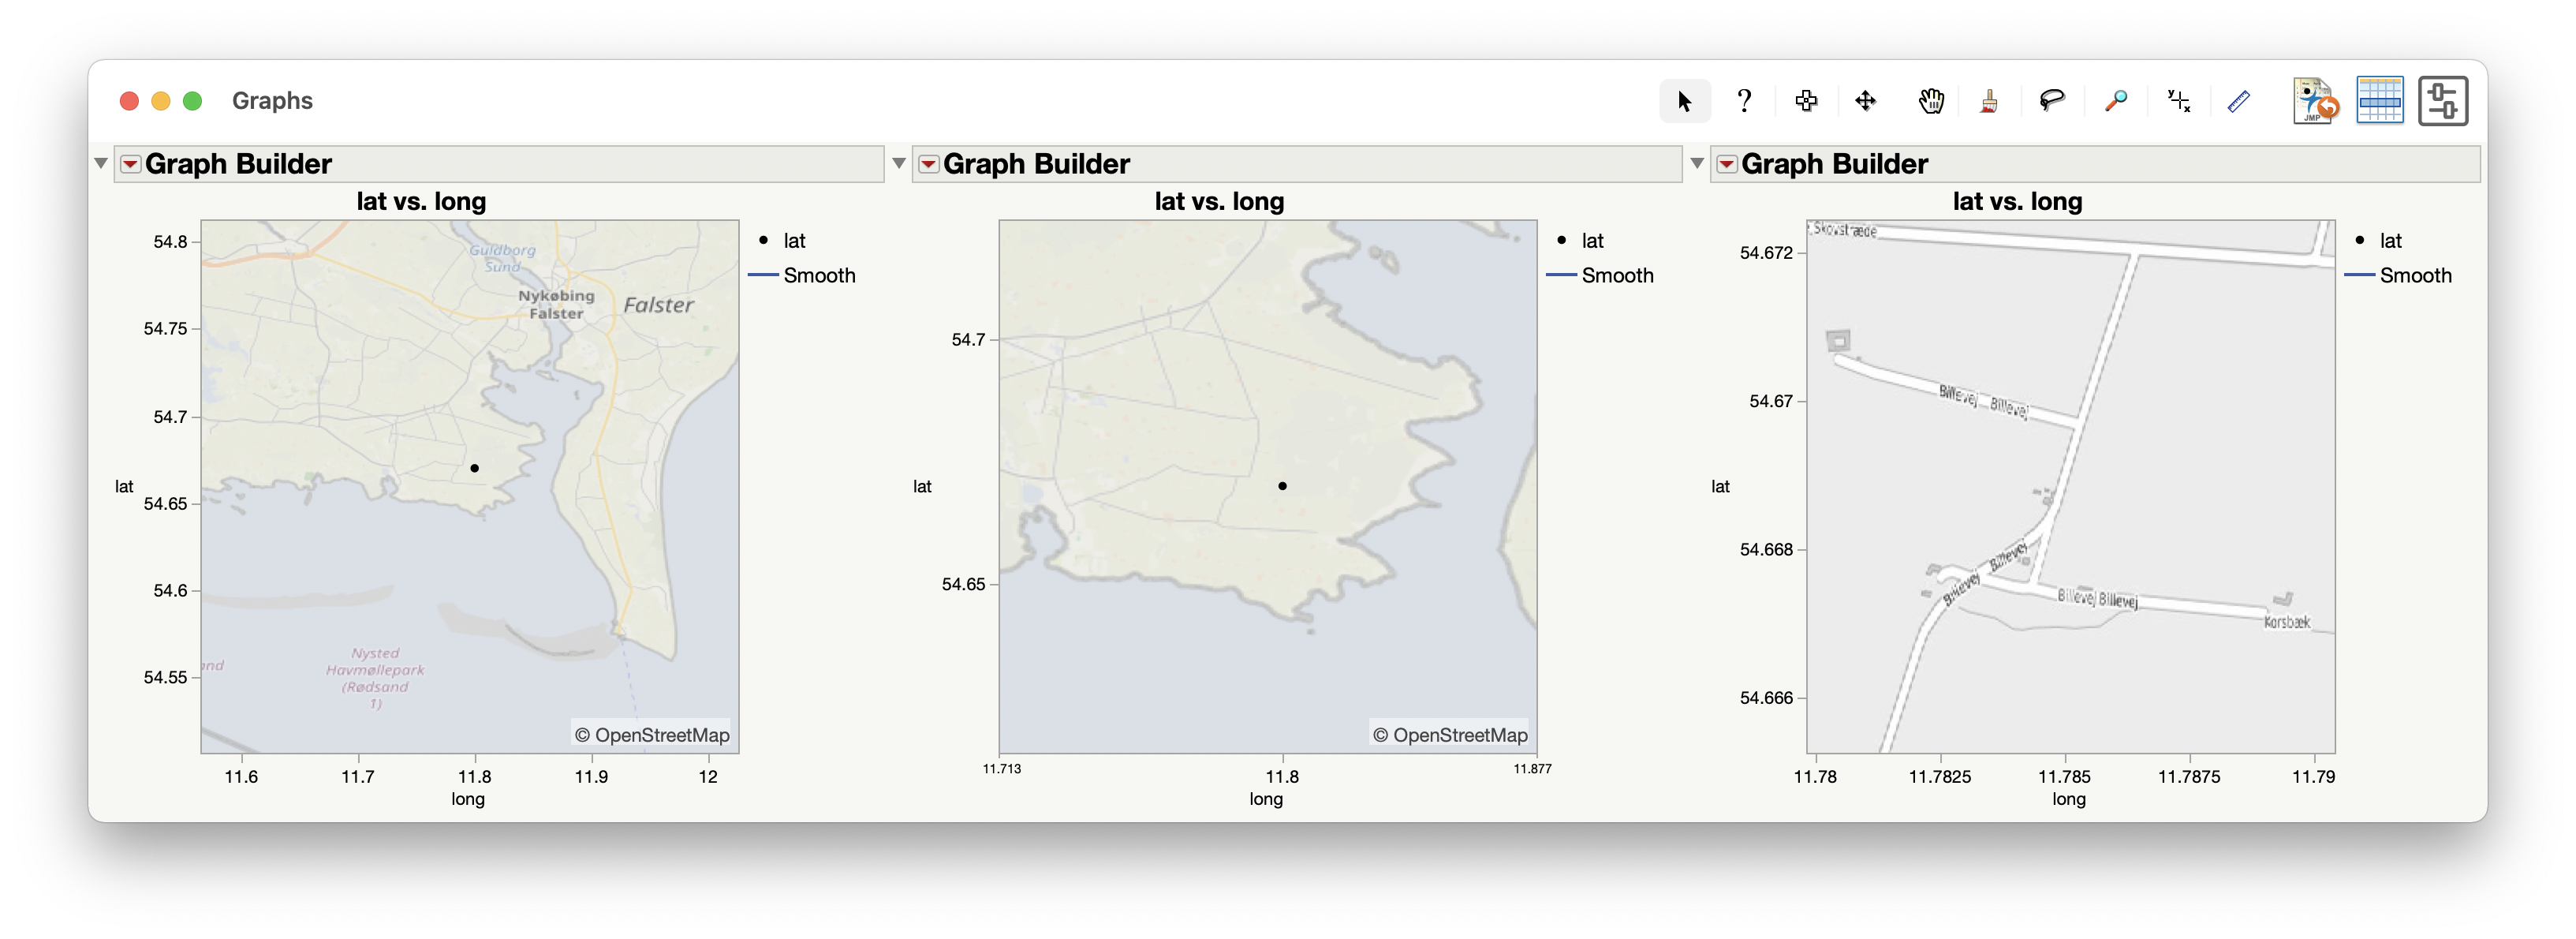
Thanks for looking into this, but unfortunately the maps are still (or again?) not working. Here the two charts on the left use the JMP map service. The middle one (slightly smaller region) is blank; I expected it to return results even when 'zoomed in' as far as the case on the right.

To reproduce:
Names default to here(1);

dt = New Table( "Coordinates",
	Add Rows( 1 ),
	New Column( "lat",
		Numeric,
		"Continuous",
		Format( "Best", 12 ),
		Set Values( [54.67] )
	),
	New Column( "long",
		Numeric,
		"Continuous",
		Format( "Best", 12 ),
		Set Values( [11.8] )
	)
);

New Window("Graphs",
	H List Box(
		dt << Graph Builder(
			Size( 400, 400 ),
			Show Control Panel( 0 ),
			Variables( X( :long ), Y( :lat ) ),
			Elements( Points( X, Y, Legend( 4 ) ), Smoother( X, Y, Legend( 5 ) ) ),
			SendToReport(
				Dispatch(
					{},
					"long",
					ScaleBox,
					{Scale( "Geodesic" ), Format( "Best", 12 ), Min( 11.5647902766448 ),
					Max( 12.0259891048949 ), Inc( 0.1 ), Minor Ticks( 0 )}
				),
				Dispatch(
					{},
					"lat",
					ScaleBox,
					{Scale( "Geodesic" ), Format( "Best", 12 ), Min( 54.4690510216314 ),
					Max( 54.8504643985809 ), Inc( 0.05 ), Minor Ticks( 0 )}
				),
				Dispatch(
					{},
					"Graph Builder",
					FrameBox,
					{Background Map( Images( "Street Map Service" ) ), Grid Line Order( 2 ),
					Reference Line Order( 3 )}
				)
			)
		),
		dt << Graph Builder(
			Size( 400, 400 ),
			Show Control Panel( 0 ),
			Variables( X( :long ), Y( :lat ) ),
			Elements( Points( X, Y, Legend( 4 ) ), Smoother( X, Y, Legend( 5 ) ) ),
			SendToReport(
				Dispatch(
					{},
					"long",
					ScaleBox,
					{Scale( "Geodesic" ), Format( "Best", 12 ), Min( 11.7134986930303 ),
					Max( 11.8772806885094 ), Inc( 0.1 ), Minor Ticks( 0 )}
				),
				Dispatch(
					{},
					"lat",
					ScaleBox,
					{Scale( "Geodesic" ), Format( "Best", 12 ), Min( 54.5890610200553 ),
					Max( 54.7509161685288 ), Inc( 0.05 ), Minor Ticks( 0 )}
				),
				Dispatch(
					{},
					"Graph Builder",
					FrameBox,
					{Background Map( Images( "Street Map Service" ) ), Grid Line Order( 2 ),
					Reference Line Order( 3 )}
				)
			)
		),
		dt << Graph Builder(
			Size( 400, 400 ),
			Show Control Panel( 0 ),
			Variables( X( :long ), Y( :lat ) ),
			Elements( Points( X, Y, Legend( 4 ) ), Smoother( X, Y, Legend( 5 ) ) ),
			SendToReport(
				Dispatch(
					{},
					"long",
					ScaleBox,
					{Scale( "Geodesic" ), Format( "Best", 12 ), Min( 11.7797994052467 ),
					Max( 11.7904094848223 ), Inc( 0.0025 ), Minor Ticks( 0 )}
				),
				Dispatch(
					{},
					"lat",
					ScaleBox,
					{Scale( "Geodesic" ), Format( "Best", 12 ), Min( 54.664777984559 ),
					Max( 54.6729172236855 ), Inc( 0.002 ), Minor Ticks( 0 )}
				),
				Dispatch(
					{},
					"Graph Builder",
					FrameBox,
					{Background Map(
						Images(
							"Web Map Service",
							"https://ows.terrestris.de/osm-gray/service?",
							"OSM-WMS"
						)
					), Grid Line Order( 2 ), Reference Line Order( 3 )}
				)
			)
		)
	)
);
- Mark as New
- Bookmark
- Subscribe
- Mute
- Subscribe to RSS Feed
- Get Direct Link
- Report Inappropriate Content
Re: Is OpenStreetMap for street-level background maps working?
Somewhere around one meter per pixel is where I see it fail in my neighborhood. I think there may be two different caches that also make it confusing, one on your computer and one on the WMS server.

- Mark as New
- Bookmark
- Subscribe
- Mute
- Subscribe to RSS Feed
- Get Direct Link
- Report Inappropriate Content
Re: Is OpenStreetMap for street-level background maps working?
I agree with DRNash. JMP 15.2.1 is not working right with Open Street Map option. It fails while zooming.
But I'm also agree with url https://ows.terrestris.de/osm/service? and 'OSM-WMS' layer. It works fine.
I truly hope JMP Open Street Map will be fixed soon.

- Mark as New
- Bookmark
- Subscribe
- Mute
- Subscribe to RSS Feed
- Get Direct Link
- Report Inappropriate Content
Re: Is OpenStreetMap for street-level background maps working?
The Map Server has been restarted.

Recommended Articles
- © 2026 JMP Statistical Discovery LLC. All Rights Reserved.
- Terms of Use
- Privacy Statement
- Contact Us