- JMP will suspend normal business operations for our Winter Holiday beginning on Wednesday, Dec. 24, 2025, at 5:00 p.m. ET (2:00 p.m. ET for JMP Accounts Receivable).
Regular business hours will resume at 9:00 a.m. EST on Friday, Jan. 2, 2026. - We’re retiring the File Exchange at the end of this year. The JMP Marketplace is now your destination for add-ins and extensions.
- Subscribe to RSS Feed
- Mark Topic as New
- Mark Topic as Read
- Float this Topic for Current User
- Bookmark
- Subscribe
- Mute
- Printer Friendly Page
Discussions
Solve problems, and share tips and tricks with other JMP users.- JMP User Community
- :
- Discussions
- :
- Inverse Prediction

- Mark as New
- Bookmark
- Subscribe
- Mute
- Subscribe to RSS Feed
- Get Direct Link
- Report Inappropriate Content
Inverse Prediction
Dear JMP experts,
I appreciate any clarification in regard to "Inverse Prediction"!
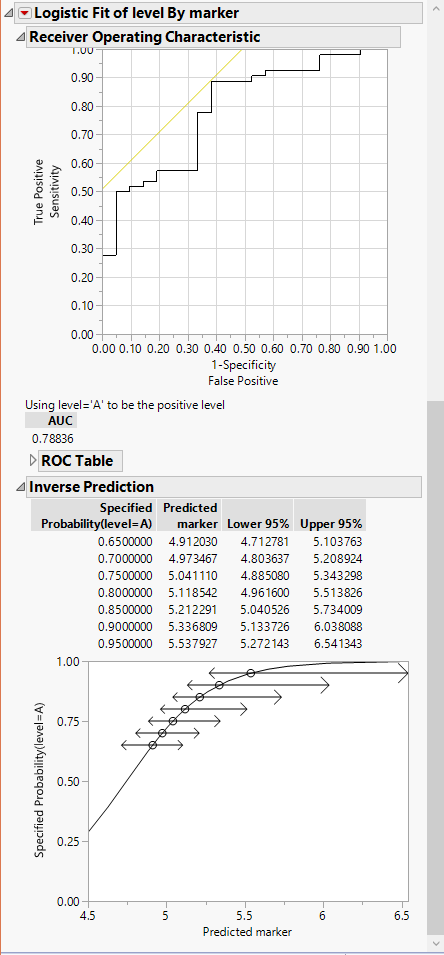
In my databse I have variable represent a biological marker, and I have two level groups (patients A and healthy B). I would like to find a cutoff value for the marker to say that this value predicts disease at specific probability (data attached).
I did logistic fit, then ROC curve, after then "Inverse Prediction" which gave me the "prediction probability" for every value of the marker (figure attached). My questions are:
1. Are the steps that I followed, correct, to find a cut off value for the marker to predict disease A.
2. What the term "Inverse Prediction" means? more specifically, what the word "inverse" stands for?
Thanks for any clarification
John
Accepted Solutions

- Mark as New
- Bookmark
- Subscribe
- Mute
- Subscribe to RSS Feed
- Get Direct Link
- Report Inappropriate Content
Re: Inverse Prediction
Start with the ROC Curve. Open the Details report. Use this table to decide the cutoff that you want that satisfies your goals for sensitivity and specificity. Peter's solution is a good one when you know the probability and want to determine the corresponding level of the biomarker.
- Mark as New
- Bookmark
- Subscribe
- Mute
- Subscribe to RSS Feed
- Get Direct Link
- Report Inappropriate Content
Re: Inverse Prediction
We usually fit a model to data, generally Y = f(X). We can then use this model to predict Y for a given X. Inverse prediction is used when we want to predict the X value that corresponds to a given Y.
- Mark as New
- Bookmark
- Subscribe
- Mute
- Subscribe to RSS Feed
- Get Direct Link
- Report Inappropriate Content
Re: Inverse Prediction
Dear markbailey, I immensely appreciate your reponse! I would like to know the methods that JMP uses to measure "Inverse prediction" for a certain variable. Is there any reference that may help to clarify how it works?
Sincerely,
John

- Mark as New
- Bookmark
- Subscribe
- Mute
- Subscribe to RSS Feed
- Get Direct Link
- Report Inappropriate Content
Re: Inverse Prediction
John:
A great place to start learning 'how' JMP does anything is the documentation. Here's a landing page for 'inverse prediction' within the JMP documentation. Inverse prediction as a method is native to several JMP analysis platforms so the exact answer to 'How does JMP do inverse prediction' is dependent upon the analysis platform that was used.
https://www.jmp.com/support/help/14/inverse-prediction.shtml
- Mark as New
- Bookmark
- Subscribe
- Mute
- Subscribe to RSS Feed
- Get Direct Link
- Report Inappropriate Content
Re: Inverse Prediction
In addition to the link provided by Peter for the definition, you can find more information by selecting Help > Books > Fitting Linear Models. Go to the Appendix for the statistical details about the inverse prediction method.
- Mark as New
- Bookmark
- Subscribe
- Mute
- Subscribe to RSS Feed
- Get Direct Link
- Report Inappropriate Content
Re: Inverse Prediction
Start with the ROC Curve. Open the Details report. Use this table to decide the cutoff that you want that satisfies your goals for sensitivity and specificity. Peter's solution is a good one when you know the probability and want to determine the corresponding level of the biomarker.
- Mark as New
- Bookmark
- Subscribe
- Mute
- Subscribe to RSS Feed
- Get Direct Link
- Report Inappropriate Content
Re: Inverse Prediction
Peter_Bartell and markbailey, I appreciate your responses. Thank you!
Recommended Articles
- © 2025 JMP Statistical Discovery LLC. All Rights Reserved.
- Terms of Use
- Privacy Statement
- Contact Us