Turn on suggestions
Auto-suggest helps you quickly narrow down your search results by suggesting possible matches as you type.
- Don’t miss your chance to experience Discovery Summit Europe at our best available rate! Early bird registration through 31 Oct.
- Graph Builder Toolbar streamlines interactive graphing. Creates shortcuts on Report and GraphBuilder Helpers toolbars. Download and install the extension.
Options
- Subscribe to RSS Feed
- Mark Topic as New
- Mark Topic as Read
- Float this Topic for Current User
- Bookmark
- Subscribe
- Mute
- Printer Friendly Page
Discussions
Solve problems, and share tips and tricks with other JMP users.- User Community
- :
- Discussions
- :
- Individual sets of data points Smoothing/Spline Fitting in Graph builder

Level I
- Mark as New
- Bookmark
- Subscribe
- Mute
- Subscribe to RSS Feed
- Get Direct Link
- Report Inappropriate Content
Individual sets of data points Smoothing/Spline Fitting in Graph builder
Jul 27, 2018 03:14 PM
(5733 views)
Hello,
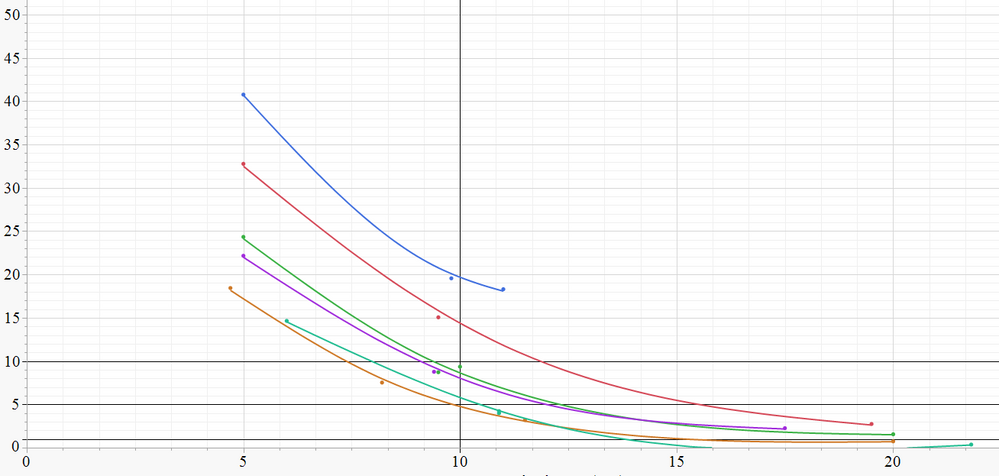
I'd like to know if there's anyway of adjusting the lambda in smoother for individual sets of datapoints. For eg: can only the fitting of the cyanish curve be modified without changing the fitting of the other curves? Thank you!
1 ACCEPTED SOLUTION
Accepted Solutions


Super User
Solution
- Mark as New
- Bookmark
- Subscribe
- Mute
- Subscribe to RSS Feed
- Get Direct Link
- Report Inappropriate Content
Re: Individual sets of data points Smoothing/Spline Fitting in Graph builder
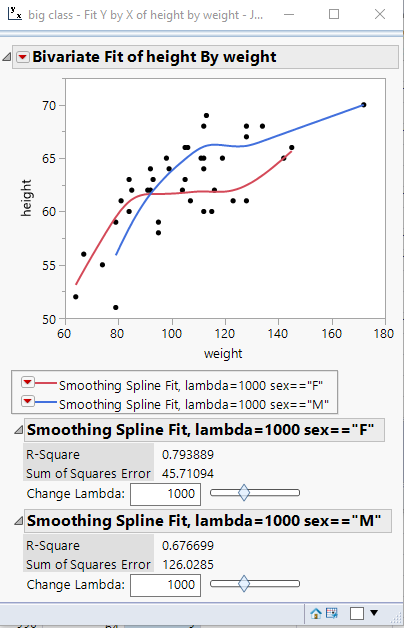
You can use Fit Y by X and then set the Group By, and then do a Flexable==>Fit Spline. Each group will have it's own Lambda slider
Names Default To Here( 1 );
dt = Open( "$SAMPLE_DATA/big class.jmp" );

dt << Bivariate(
	Y( :height ),
	X( :weight ),
	Fit Where( :sex == "F", Fit Spline( 1000, {Line Color( {212, 73, 88} )} ) ),
	Fit Where( :sex == "M", Fit Spline( 1000, {Line Color( {66, 112, 221} )} ) )
);
Jim
1 REPLY 1
Super User
Solution
- Mark as New
- Bookmark
- Subscribe
- Mute
- Subscribe to RSS Feed
- Get Direct Link
- Report Inappropriate Content
Re: Individual sets of data points Smoothing/Spline Fitting in Graph builder
You can use Fit Y by X and then set the Group By, and then do a Flexable==>Fit Spline. Each group will have it's own Lambda slider
Names Default To Here( 1 );
dt = Open( "$SAMPLE_DATA/big class.jmp" );

dt << Bivariate(
	Y( :height ),
	X( :weight ),
	Fit Where( :sex == "F", Fit Spline( 1000, {Line Color( {212, 73, 88} )} ) ),
	Fit Where( :sex == "M", Fit Spline( 1000, {Line Color( {66, 112, 221} )} ) )
);
Jim
Recommended Articles
- © 2026 JMP Statistical Discovery LLC. All Rights Reserved.
- Terms of Use
- Privacy Statement
- Contact Us