- JMP Statement Regarding Critical PHP Remote Code Execution Vulnerabilities (CVE-2026-109618, CVE-2026-109619)
- Don’t miss your chance to experience Discovery Summit Europe at our best available rate! Early bird registration through 31 Oct.
- Graph Builder Toolbar streamlines interactive graphing. Creates shortcuts on Report and GraphBuilder Helpers toolbars. Download and install the extension.
- Subscribe to RSS Feed
- Mark Topic as New
- Mark Topic as Read
- Float this Topic for Current User
- Bookmark
- Subscribe
- Mute
- Printer Friendly Page
Discussions
Solve problems, and share tips and tricks with other JMP users.- User Community
- :
- Discussions
- :
- Re: Identifying steady-state slope via linear regression

- Mark as New
- Bookmark
- Subscribe
- Mute
- Subscribe to RSS Feed
- Get Direct Link
- Report Inappropriate Content
Identifying steady-state slope via linear regression
Hi,
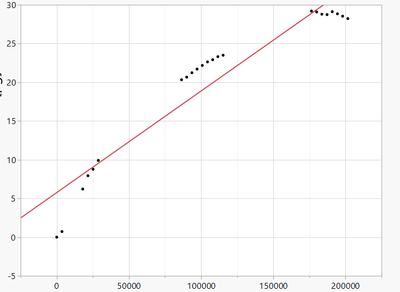
I am looking for a way to identify which data points to include in my bivariate linear regression. The slope is increasing, then reaching a steady state and subsequently decreasing. I would like to use linear regression in the steady state phase and want to use statistics to determine which data points should be included in this i.e. when the steady state is reached and the residuals for the trendline are minimal. So far, I have fitted a line with different sets of data points and compared R2. However, there must be a smarter way to do this...
Looking forward to any advice :)

- Mark as New
- Bookmark
- Subscribe
- Mute
- Subscribe to RSS Feed
- Get Direct Link
- Report Inappropriate Content
Re: Identifying steady-state slope via linear regression
Cherry picking points to support a hypothesis in a data set like this is art at best. Plus after looking at the graph one could start an argument that with the gaps in the data, there is NO data at 'steady state', whatever that means. Slope = 0 vs Slope not equal to zero? At what alpha risk? The underlying process generating the data is at some 'steady state' that has an underlying physical/biological/socioeconomic basis? IMO too much unknown to answer the question on what basis to cherry pick points.


- Mark as New
- Bookmark
- Subscribe
- Mute
- Subscribe to RSS Feed
- Get Direct Link
- Report Inappropriate Content
Re: Identifying steady-state slope via linear regression
First, welcome to the community. As usual, Pete's comments are right on. I'll add some thoughts:
1. What is the intent of this exercise? Is this a real situation or purely academic? Why would you remove data form the data set? You might be removing the most informative information. How adequate is the measurement system?
2. What is your definition of "steady state"? I don't see any steady state in the picture you attached. I see what appears to be 3 groups of data with large gaps in the data. There is a group that forms a fairly straight line, but without context, that is meaningless (and a really small data set at that).
3. If your question is what outlier tests could you do, there are many. Which you use depends on how the data was acquired. You could use time series tests, multivariate tests, residual plots, leverage plots, etc.
4. Realize R^2 is just one statistic. Whether it is a good indicator of your models adequacy depends on how the data was acquired. A better use of R^2 in model building is the examine the delta between the R^2 and the R^2 adjusted. Large deltas are indicators of over-specified models. You might want to consider RMSE, p-values along with residuals plots.
- Mark as New
- Bookmark
- Subscribe
- Mute
- Subscribe to RSS Feed
- Get Direct Link
- Report Inappropriate Content
Re: Identifying steady-state slope via linear regression
First of all, thank you very much for your replies and i am very sorry that i can only respond now....
To provide some background, this is the theoretical graph we are expecting and the slope and time lag are the corresponding results.
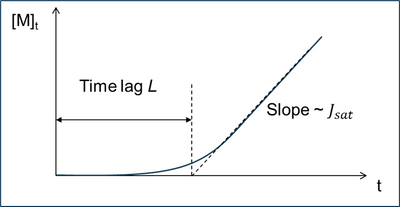
In our experiment we are acquiring data points over the course of days and are expecting a slow increase in slope and then the reaching of steady state (i.e. only minor fluctuations in slope). Subsequently the slope will flatten as additional factors come into play. As these are real-time data points, sampling over night is not possible which results in gaps in the data points and as this setup is new we do not know whether steady state is reached at day one or day 5. Once this is more clear we will add additional sampling points in the area of interest. To find out about this i need to identify the timeframe when steady state is reached and this is what my question is relating to. So for example with this data set:
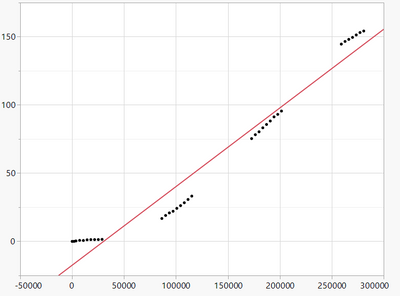
i can already see that the first and the last set of data points are not relevant so i am excluding these data points.
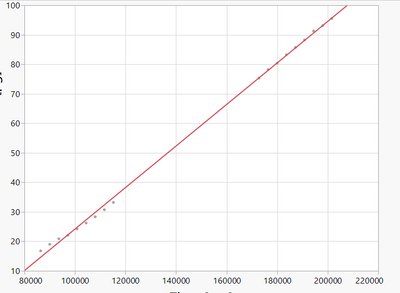
Looking at these data points that are left i am looking for a tool to decide which data points should be included as they contribute to the accuracy of the slope at steady state and additional effects before and after the steady state are excluded. For this i had so far created linear fits while excluding more and more data points and then looking at the R2. You mentioned looking at the residuals, is there a cutoff you would recommend? I will add the residual plots below.
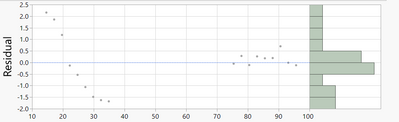
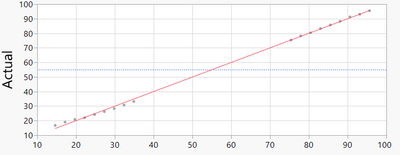
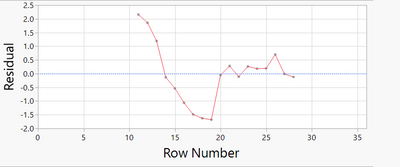
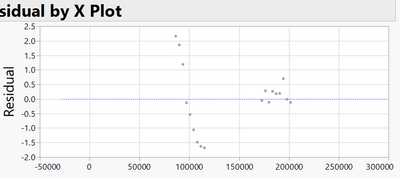
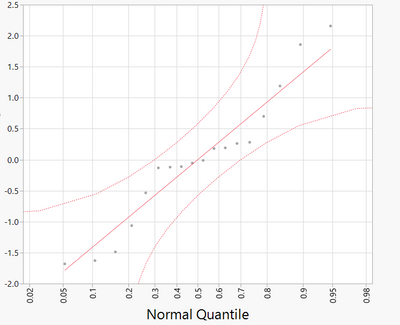
Thanks again for your responses!
- Mark as New
- Bookmark
- Subscribe
- Mute
- Subscribe to RSS Feed
- Get Direct Link
- Report Inappropriate Content
Re: Identifying steady-state slope via linear regression
OK...I'm still not clear. Are you trying to estimate:
1. A starting point in t when the slope is constant (at some level of confidence)? Based on the theoretical graph, this point in t will be greater than the line extension back to the x axis.
2. A point in t that corresponds to the asymptote? The theoretical graph you posted seems to be doing this..
Or something else?
Since you raise the specter of additional sampling in the space in t where you think the slope is now first acting as a constant...why don't you just eyeball that point as you are doing in the second graphs you shared. Close enough for government work if you will. Then you gather additional data in the region to confirm or deny the assertion that the slope is unchanging.
Or maybe I'm just lost?
- Mark as New
- Bookmark
- Subscribe
- Mute
- Subscribe to RSS Feed
- Get Direct Link
- Report Inappropriate Content
Re: Identifying steady-state slope via linear regression
I am doing the experiments in order to get values for the slope and time lag described in the picture I had send. For this I need to find the data points where the slope is constant and then do linear regression to calculate the intercept with the x axis of this . I hope this makes it more clear?


- Mark as New
- Bookmark
- Subscribe
- Mute
- Subscribe to RSS Feed
- Get Direct Link
- Report Inappropriate Content
Re: Identifying steady-state slope via linear regression
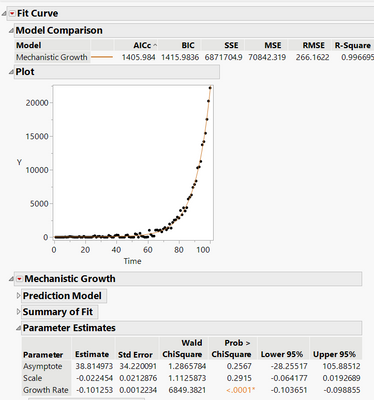
The Fit Curve platform can both a) generate parameters for curves and b) show derivatives for the slope of the curve. In the example below, you could use the asymptote of 38.8 to indicate the end of the flat section/start of the upwards section. There are a bunch of assumptions going into this though, first of which is that you could find a curve that both fits your data and fits the theory of why your data is shaped the way it is.
I've attached a file with a script embedded as an example.

- Mark as New
- Bookmark
- Subscribe
- Mute
- Subscribe to RSS Feed
- Get Direct Link
- Report Inappropriate Content
Re: Identifying steady-state slope via linear regression
You might try the nonlinear platform and specify parameters for where the slopes change. The nonlinear platform will solve for these parameters (as well as the slopes), or at least try to find a solution. It has worked very well for me, but I'm not sure it will work if you only have the few data points you show in your image.
Recommended Articles
- © 2026 JMP Statistical Discovery LLC. All Rights Reserved.
- Terms of Use
- Privacy Statement
- Contact Us