Don’t miss your chance to experience Discovery Summit Europe at our best available rate! Early bird registration through 31 Oct.
Graph Builder Toolbar streamlines interactive graphing. Creates shortcuts on Report and GraphBuilder Helpers toolbars. Download and install the extension.
How to use JSL of JMP software to find the one that is more suitable for sinusoidal curve from multiple sets of data?
Jul 25, 2023 02:44 AM(1147 views)
Hello!
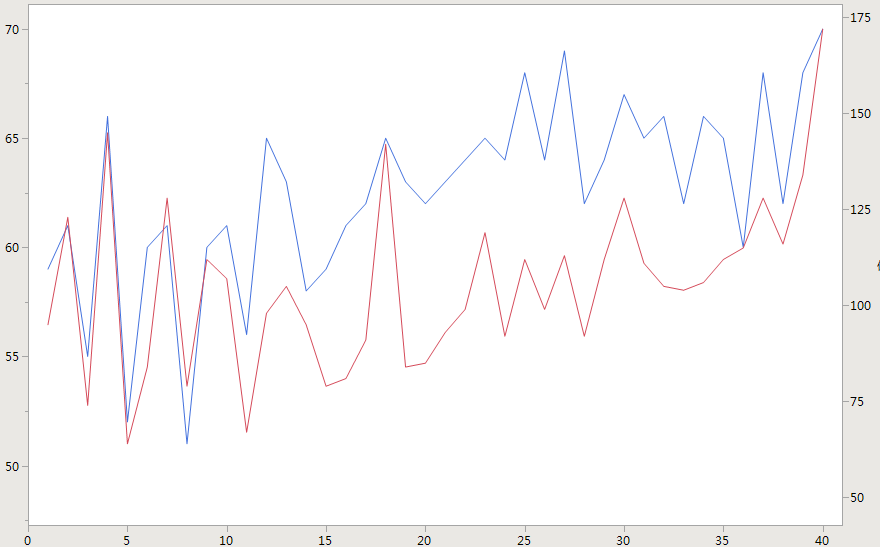
For example, using large class data: Compare the height column and the weight column to see which column fits the sinusoidal distribution better. The parameters of the sine curve are random.