- Instantly extract effect sizes, F-ratios, and FDR-adjusted p-values from your models with the Calculate Effects Sizes extension, available now in the JMP Marketplace!
- New to JMP? Join us Sept. 23-24 for the Early User Edition of Discovery Summit, tailor-made for new users. Register now for free!
- See how to use the JMP Marketplace – Free tools to expand JMP capabilities. Register. July 10, 2 pm US Eastern Time.
- Subscribe to RSS Feed
- Mark Topic as New
- Mark Topic as Read
- Float this Topic for Current User
- Bookmark
- Subscribe
- Mute
- Printer Friendly Page
Discussions
Solve problems, and share tips and tricks with other JMP users.- JMP User Community
- :
- Discussions
- :
- How to show reference line labels in Normal Quantile Plot (JMP 16)?

- Mark as New
- Bookmark
- Subscribe
- Mute
- Subscribe to RSS Feed
- Get Direct Link
- Report Inappropriate Content
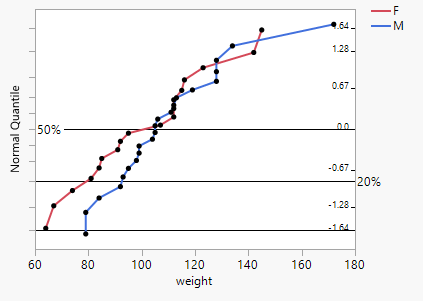
How to show reference line labels in Normal Quantile Plot (JMP 16)?
This question is about the Normal Quantile Plot in JMP 16.
Is it possible to show reference line labels on the primary Y-axis (Label Position: Outside, Label Axis Side: Same)?
Here is what I have done:
Sample data file: Big Class.jmp
Analyze > Fit Y by X
Y, Response: weight
X, factor: sex
In the resulting Normal Quantile Plot I removed Y-axis Grid Lines and Labels, and attempted to replace them with my own Reference Lines and labels.
For 50% reference line I used:
Label Position: Inside Inline
Label Axis Side: Same
For 50% reference line I used:
Label Position: Inside Inline
Label Axis Side: Same (The label shows up as expected.)
For 20% reference line I used:
Label Position: Outside
Label Axis Side: Opposite (The label shows up as expected.)
For 5% reference line I used:
Label Position: Outside
Label Axis Side: Same (The label does not show up on the plot!)
I would like to eventually implement this in a script, but I couldn’t figure out how to do it in a script either.

- Mark as New
- Bookmark
- Subscribe
- Mute
- Subscribe to RSS Feed
- Get Direct Link
- Report Inappropriate Content
Re: How to show reference line labels in Normal Quantile Plot (JMP 16)?
For some reason you cannot display reference lines on main Y-axis if you are using Normal Probability as axis type.
Names Default To Here(1);

dt = Open("$SAMPLE_DATA/Big Class.jmp");

ow = dt << Oneway(
	Y(:weight),
	X(:sex),
	All Graphs(0),
	Plot Quantile by Actual(1),
	SendToReport(Dispatch({"Normal Quantile Plot"}, "2", ScaleBox, {Label Row({Show Major Grid(0), Show Major Labels(0)})}))
);

//calculate quantiles

//set reference lines
axisbox = Report(ow)[AxisBox(1)];
axisbox << Add Ref Line(0.05, "Solid", "Black", "5%", 1, 1, Label Settings({Label Position("Outside"), Opposite Axis(0)}));
axisbox << Add Ref Line(0.2, "Solid", "Black", "20%", 1, 1, Label Settings({Label Position("Outside"), Opposite Axis(1)}));
axisbox << Add Ref Line(0.5, "Solid", "Black", "50%", 1, 1, Label Settings({Label Position("Inside Inline"), Opposite Axis(0)}));
axisbox << Add Ref Line(0.1, "Solid", "Black", "10%", 1, 1, Label Settings({Label Position("Outside"), Opposite Axis(0)}));

wait(2);
axisbox << Scale("Linear");
axisbox << Show Major Labels(0);
axisbox << Show Major Grid(0);
wait(2);
axisbox << Scale("Normal Probability");
axisbox << Show Major Labels(0);
axisbox << Show Major Grid(0);- Mark as New
- Bookmark
- Subscribe
- Mute
- Subscribe to RSS Feed
- Get Direct Link
- Report Inappropriate Content
Re: How to show reference line labels in Normal Quantile Plot (JMP 16)?
@jthi Thank you for the prompt and thorough response. I ran your script in JMP 13, and it produced the result that I wanted (reference line labels display properly), because JMP 13 does not understand Label Settings (Label Position & Label Axis Side). However, JMP 16 does understand Label Settings, and does let me do what I want. Should this be reported as a bug in JMP 16?
JMP 13 plot:

JMP 16 plot:

- Mark as New
- Bookmark
- Subscribe
- Mute
- Subscribe to RSS Feed
- Get Direct Link
- Report Inappropriate Content
Re: How to show reference line labels in Normal Quantile Plot (JMP 16)?
I think it is worth reporting this to JMP Support through email. They will know if it is working as intended or not (to me it seems like it isn't working as intended in JMP16).
Recommended Articles
- © 2026 JMP Statistical Discovery LLC. All Rights Reserved.
- Terms of Use
- Privacy Statement
- Contact Us