- Don’t miss your chance to experience Discovery Summit Europe at our best available rate! Early bird registration through 31 Oct.
- Image to Table JMP extension imports single or batch images as data tables. Useful to extract curves from pictures or convert image data to curve data to use in analyses like Functional Data Explorer. Download and install the extension.
- Subscribe to RSS Feed
- Mark Topic as New
- Mark Topic as Read
- Float this Topic for Current User
- Bookmark
- Subscribe
- Mute
- Printer Friendly Page
Discussions
Solve problems, and share tips and tricks with other JMP users.- User Community
- :
- Discussions
- :
- How to show 2 histograms based on date for the same data ?

- Mark as New
- Bookmark
- Subscribe
- Mute
- Subscribe to RSS Feed
- Get Direct Link
- Report Inappropriate Content
How to show 2 histograms based on date for the same data ?
Hi
I have a set of data for a variable starting on March 2021.
But we did a modification on the process after May 2022
I would like now to see the impact in the distribution before and after May 1st 2022
How can I simply do this ?
Thanks


- Mark as New
- Bookmark
- Subscribe
- Mute
- Subscribe to RSS Feed
- Get Direct Link
- Report Inappropriate Content
Re: How to show 2 histograms based on date for the same data ?
Hi @LogitTurtle576 ,
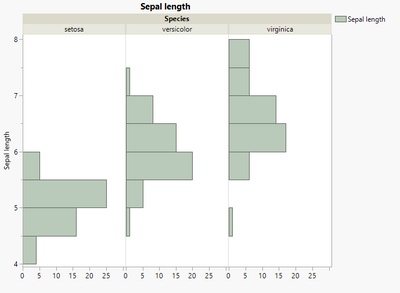
You could make a new column in your table indicating whether each row is before or after the process change, and then launch the distribution platform including that new variable in the 'by' group (hint: use a formula to check if the data column is greater than a specific date). Or, you could use the distribution within graph builder and add the new variable as a grouping variable, similar to what the Species variable does in this chart:


- Mark as New
- Bookmark
- Subscribe
- Mute
- Subscribe to RSS Feed
- Get Direct Link
- Report Inappropriate Content
Re: How to show 2 histograms based on date for the same data ?
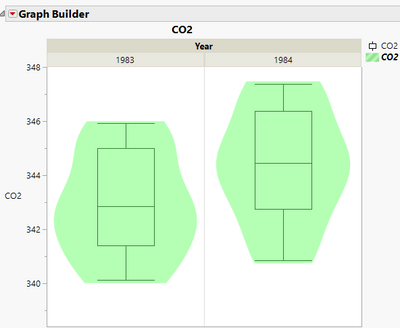
@ih provides a good answer, however, I prefer using Box Plots in combination with Violin plots to give the true picture of what the pre and post distributions look like.
- Mark as New
- Bookmark
- Subscribe
- Mute
- Subscribe to RSS Feed
- Get Direct Link
- Report Inappropriate Content
Re: How to show 2 histograms based on date for the same data ?
Thanks to both of you for the quick answer.
Recommended Articles
- © 2026 JMP Statistical Discovery LLC. All Rights Reserved.
- Terms of Use
- Privacy Statement
- Contact Us