cancel
Showing results for 
Show  only  | Search instead for 
Did you mean: 
  • New to JMP? Join us Sept. 23-24 for the Early User Edition of Discovery Summit, tailor-made for new users. Register now for free!
  • Your voice matters! Tell us how you prefer to receive JMP updates, so we can tailor our communication to your needs. Take short survey.
  • See how to access JMP Marketplace - and - find, create & share add-ins to extend your JMP. Watch video.

Discussions

Solve problems, and share tips and tricks with other JMP users.
Choose Language Hide Translation Bar
CompleteLeopard
Level III

How to set spec limits color

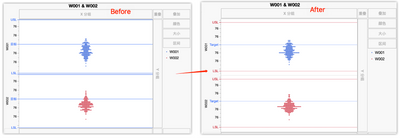
Hi, JMPer I have used JSL to load spec limits into column Properties. But when generate graph or distribution charts, the spec limits' color is bule.

My question is: 

1.How to change the colors to red and line to dot?

2.I used chinese vision, how to change it to english?

CompleteLeopard_0-1681600342912.png


10 REPLIES 10
Victor_G
Super User

Re: How to set spec limits color

Hi @Gabogom,

To create a range of color in any graph, right-click on the Y axis, choose "Axis Settings", check the box "Allow ranges" and specify the min and max values with the color associated to the range:


Victor_G_0-1776753631148.png

Once you click on OK, the range color can be seen in the Prediction Profiler (or any other graph you want to customize):

Victor_G_1-1776753686224.png

Hope this answer will help you,

Victor GUILLER

"It is not unusual for a well-designed experiment to analyze itself" (Box, Hunter and Hunter)

Recommended Articles