- Don’t miss your chance to experience Discovery Summit Europe at our best available rate! Early bird registration through 31 Oct.
- Graph Builder Toolbar streamlines interactive graphing. Creates shortcuts on Report and GraphBuilder Helpers toolbars. Download and install the extension.
- Subscribe to RSS Feed
- Mark Topic as New
- Mark Topic as Read
- Float this Topic for Current User
- Bookmark
- Subscribe
- Mute
- Printer Friendly Page
Discussions
Solve problems, and share tips and tricks with other JMP users.- User Community
- :
- Discussions
- :
- How to set spec limits color

- Mark as New
- Bookmark
- Subscribe
- Mute
- Subscribe to RSS Feed
- Get Direct Link
- Report Inappropriate Content
How to set spec limits color
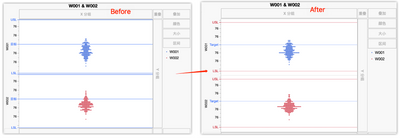
Hi, JMPer I have used JSL to load spec limits into column Properties. But when generate graph or distribution charts, the spec limits' color is bule.
My question is:
1.How to change the colors to red and line to dot?
2.I used chinese vision, how to change it to english?
- Mark as New
- Bookmark
- Subscribe
- Mute
- Subscribe to RSS Feed
- Get Direct Link
- Report Inappropriate Content
Re: How to set spec limits color
Who can help?


- Mark as New
- Bookmark
- Subscribe
- Mute
- Subscribe to RSS Feed
- Get Direct Link
- Report Inappropriate Content
Re: How to set spec limits color
Hi @CompleteLeopard,
If you right-click on the left axis and select "Axis Settings...", you'll have access to more customization for the specs reference lines aspects and names :
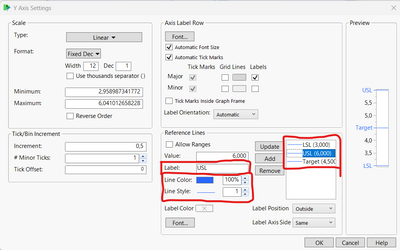
You can do it manually, save your graph preferences, and then look at the script so that you can re-use automatically the settings you have modified.
For this graph :
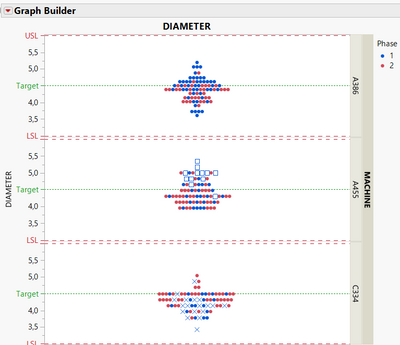
My JSL script now looks like this (you can see the new properties for reference lines just after the first "scalebox" with the functions "Add Ref Line" and the settings behind) :
Graph Builder(
	Size( 570, 503 ),
	Show Control Panel( 0 ),
	Variables( Y( :DIAMETER ), Group Y( :MACHINE ), Color( :Phase ) ),
	Elements( Points( Y, Legend( 14 ) ) ),
	SendToReport(
		Dispatch(
			{},
			"DIAMETER",
			ScaleBox,
			{Add Ref Line( 3, "Dashed", "Medium Dark Red", "LSL", 1 ),
			Add Ref Line( 6, "Dashed", "Medium Dark Red", "USL", 1 ),
			Add Ref Line( 4.5, "Dotted", "Medium Dark Green", "Target", 1 )}
		),
		Dispatch(
			{},
			"400",
			ScaleBox,
			{Legend Model(
				14,
				Properties( 0, {Line Color( 21 )}, Item ID( "1", 1 ) )
			)}
		)
	)
);
I hope this answer will help you,
"It is not unusual for a well-designed experiment to analyze itself" (Box, Hunter and Hunter)
- Mark as New
- Bookmark
- Subscribe
- Mute
- Subscribe to RSS Feed
- Get Direct Link
- Report Inappropriate Content
Re: How to set spec limits color
Thanks. But is it possible or is there any way to auto change the color to red?
Because it had many columns which need to build graphs with spec limits.
- Mark as New
- Bookmark
- Subscribe
- Mute
- Subscribe to RSS Feed
- Get Direct Link
- Report Inappropriate Content
Re: How to set spec limits color
I'm not a JSL pro scripter, but there are other topics dealing with the automatic creation of spec limits in graph :
Solved: [JSL] Spec limits and reference lines - JMP User Community
Spec Limit Lines on Graphs - JMP User Community
Solved: Show as graph reference lines - JMP User Community
You might be able to use the JSL code, and modify it to change the color.
Maybe other community members will have more precise answers for this part,
"It is not unusual for a well-designed experiment to analyze itself" (Box, Hunter and Hunter)
- Mark as New
- Bookmark
- Subscribe
- Mute
- Subscribe to RSS Feed
- Get Direct Link
- Report Inappropriate Content
Re: How to set spec limits color
Thanks. But they are not the solutions for me.

- Mark as New
- Bookmark
- Subscribe
- Mute
- Subscribe to RSS Feed
- Get Direct Link
- Report Inappropriate Content
Re: How to set spec limits color
Can you explain more about what you mean by auto changing the color?
The scripting that @Victor_G provided is an excellent example of how JSL's code can assign line color and line type. Do you want some type of user input or the color to be changed based upon some type of criteria in your data? Something else? Please help us understand.
- Mark as New
- Bookmark
- Subscribe
- Mute
- Subscribe to RSS Feed
- Get Direct Link
- Report Inappropriate Content
Re: How to set spec limits color
I had one csv file which contains columns SN,A_CAVITY,C_CAVITY,W1,W2,W3 , each row have the different data; Had another spec limits "Limits_jmp" contains columns FAI, Target, USL,LSL, had three rows for FAI in W1/W2/W3's spec.
I used below jsl to auto generate graph and auto load Target,USL,LSL for each FAI(W1/W2/W3). But when use graph builder the default color for Target,USL,LSL is blue, how to change the color to red?
JSL:
dt = OPEN(“DATA.CSV");

dt<<Graph Builder(
Size( 868, 586 ),
Variables(
X( :A_CAVITY ),
X( :C_CAVITY, Position( 1 ) ),
Y( :W1 ),
Y( :P_X, Position( 1 ) ),
Y( :W2 ),

),
);
obj=dt<<Process Capability(
Process Variables(:W1, :W2, :W3),
Spec Limits(
Import Spec Limits("Limits.jmp")
),
Moving Range Method( Average of Moving Ranges ),
Goal Plot( 1 ),
Capability Index Plot( 1 ),
Process Performance Plot( 0 )
);
obj << Save Spec Limits as Column Properties;
//Wait( 0 );
obj << Close Window;
obj = dt <<
Manage Limits(
Process Variables(:W1, :W2, :W3
),

);
obj << Show Limits All;
obj << Close Window;
Close("Limits.jmp");- Mark as New
- Bookmark
- Subscribe
- Mute
- Subscribe to RSS Feed
- Get Direct Link
- Report Inappropriate Content
Re: How to set spec limits color
I've looked through JMP preferences (Windows: File > Preferences > Platform > Graph Builder) and the scripting guide and have found no way to change the default color. If you want the reference line to change automatically when you run either a script from the table or a script window, the script @Victor_G provided provides a great example of how you can proceed changing the reference line color.
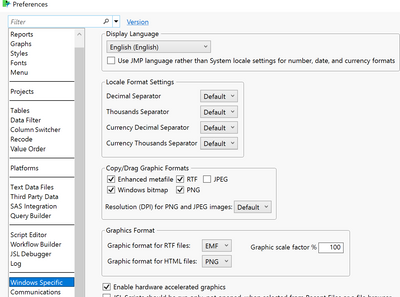
For your second question about language, Go into JMP preferences (Windows: File > Windows specific) you can find the language option as the top drop down menu.

- Mark as New
- Bookmark
- Subscribe
- Mute
- Subscribe to RSS Feed
- Get Direct Link
- Report Inappropriate Content
Re: How to set spec limits color

But this type, how we can do it?
Recommended Articles
- © 2026 JMP Statistical Discovery LLC. All Rights Reserved.
- Terms of Use
- Privacy Statement
- Contact Us