- Subscribe to RSS Feed
- Mark Topic as New
- Mark Topic as Read
- Float this Topic for Current User
- Bookmark
- Subscribe
- Mute
- Printer Friendly Page
Discussions
Solve problems, and share tips and tricks with other JMP users.- JMP User Community
- :
- Discussions
- :
- How to save script permanently with data table
- Mark as New
- Bookmark
- Subscribe
- Mute
- Subscribe to RSS Feed
- Get Direct Link
- Report Inappropriate Content
How to save script permanently with data table
I want to save a script (e.g. for creating a graph) with a data table so that I can reuse it whenever I open this data table. However, if I close the Graph Builder window or save the data table, the scripts "saved" to the data table are gone.
What am I doing wrong?
- Mark as New
- Bookmark
- Subscribe
- Mute
- Subscribe to RSS Feed
- Get Direct Link
- Report Inappropriate Content
Re: How to save script permanently with data table
File==>New
- Mark as New
- Bookmark
- Subscribe
- Mute
- Subscribe to RSS Feed
- Get Direct Link
- Report Inappropriate Content
Re: How to save script permanently with data table
@Knut wrote:
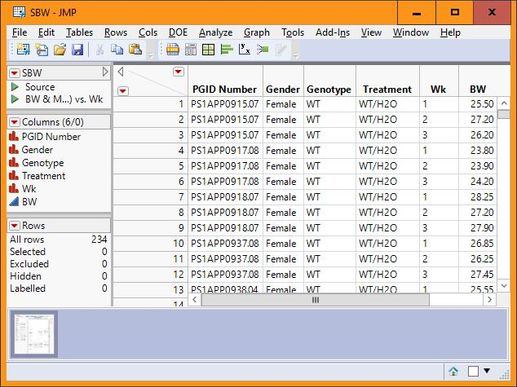
Here's one of these cases. I've created a table with all the data I need to create a graph (or to do some an alysis). I've used Graph Builder to create the graph and chose "Save Script / To Data Table" - and there it is below the data table:
Now I save the data table to SBW.jmp - done.
After some time I learn that some of the data needs to be corrected, so I reopen the data table, and the graph is gone - bummer.
Now, we're getting somewhere. Thanks for posting the screen shot. That and your comment "there it is below the data table" now explains the confusion.
The thumbnails below the data table show the reports windows that are based on that data table. They are not part of the data table. They don't have anything to do with saving scripts to the data table – they show up with every report window you open on that data table, whether you save a script to the data table or not. And, as you've discovered, they aren't saved with the data table.
From what I learned from you, the script is actually there (having a green triangle), but not where I had expected it. Maybe subheadings "Graphs", "Analyses", ... separating the green triangles would help?
You can do this by selecting multiple scripts and right-clicking on them and choosing Group scripts.
- Mark as New
- Bookmark
- Subscribe
- Mute
- Subscribe to RSS Feed
- Get Direct Link
- Report Inappropriate Content
Re: How to save script permanently with data table
- « Previous
-
- 1
- 2
- Next »
Recommended Articles
- © 2026 JMP Statistical Discovery LLC. All Rights Reserved.
- Terms of Use
- Privacy Statement
- Contact Us


