- Don’t miss your chance to experience Discovery Summit Europe at our best available rate! Early bird registration through 31 Oct.
- Graph Builder Toolbar streamlines interactive graphing. Creates shortcuts on Report and GraphBuilder Helpers toolbars. Download and install the extension.
- JMP will suspend normal business operations for our Rest and Recharge Day on Friday, October 2, 2026.
Regular business hours will resume on Monday, October 5, 2026.
- Subscribe to RSS Feed
- Mark Topic as New
- Mark Topic as Read
- Float this Topic for Current User
- Bookmark
- Subscribe
- Mute
- Printer Friendly Page
Discussions
Solve problems, and share tips and tricks with other JMP users.- User Community
- :
- Discussions
- :
- Re: How to run analysis of 1 binomial data set and 1 nominal data set.

- Mark as New
- Bookmark
- Subscribe
- Mute
- Subscribe to RSS Feed
- Get Direct Link
- Report Inappropriate Content
How to run analysis of 1 binomial data set and 1 nominal data set.
Hi everyone,
This is my first post here as I am very new to JMP pro. I am a novice at stats and could use some guidance. I have a data set where 1 column is tree type (lets say type 1, 2, or 3) and the other column is binomial (1,0) dead or alive. I am trying to get the statistical significance for the difference in average % mortality by tree type.
Basically I need the hard stats to explain the figure below:
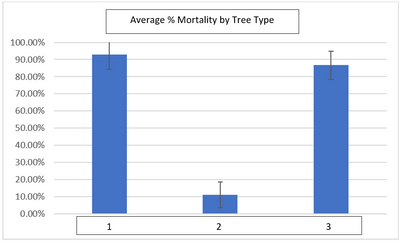
Any help would be really appreciated!
- Mark as New
- Bookmark
- Subscribe
- Mute
- Subscribe to RSS Feed
- Get Direct Link
- Report Inappropriate Content
Re: How to run analysis of 1 binomial data set and 1 nominal data set.
When you say "cast Count in the Freq role" what is "count and how do I add it?


- Mark as New
- Bookmark
- Subscribe
- Mute
- Subscribe to RSS Feed
- Get Direct Link
- Report Inappropriate Content
Re: How to run analysis of 1 binomial data set and 1 nominal data set.
I was referring to the variables as I named them in my mock up of your study. You select the column with the frequencies and click Freq button. If you do not have a pre-summarized table as I made, then you have each observation on a separate row, in which case you do not need the Freq role.
- « Previous
-
- 1
- 2
- Next »
Recommended Articles
- © 2026 JMP Statistical Discovery LLC. All Rights Reserved.
- Terms of Use
- Privacy Statement
- Contact Us